
Articles
How to Search for Property Sales History Online
Over three years, a buyer built a portfolio of five properties for investment and residential purposes. However, not every deal paid off due to a lack of research into the property’s sales history, resulting in overpaying compared to market rates on some purchases.
For purchases after that, he started using Landchecker to check a property’s sales history, including last sold prices, comparable sales, land size and dimensions, frontage, planning permits/DAs, easements and high-resolution aerial imagery before negotiating.
Having comprehensive sales history data meant negotiations and appraisals were backed by real numbers. He also gained a better understanding of a property’s long-term development potential and saved days or weeks before contracts were reviewed or solicitor searches were conducted.
Understanding the current market value of a property is perhaps the best way to reduce the risk of overpaying or undervaluing it. It’s equally important data for sellers, buyers and agents – and that’s where property sales history comes in.
As you’ll discover below, you don’t have to scour the internet high and low, as all of this information is available in one place, right at your fingertips. This guide covers where you can access a property’s sales history, what the data includes, how to read and interpret the data, and how to use it for smarter property decisions.
We sourced our property sales history data through different Australian states and territory government authorities, including the NSW Valuer General, the Victorian Government, Western Australian Land Information Authority (WALIA) trading as Landgate, Department of Lands and Planning in the Northern Territory, the Crown in Right of Tasmania, Queensland’s Department of Natural Resources and Mines, South Australian Government, and Australian Capital Territory.
Why Property Sales History Matters
So, why exactly is property sales history valuable for you? Property agents have been using property sales data for years to garner a more complete view of a property’s value, including how this has fluctuated over time (to help in their market research and sale efforts).
A home may have been valued at $X amount 5 years ago (or even 12 months ago), but what changes may have impacted its value since then – and how do other properties in the area compare?
Apart from individual factors that play a part in a home’s value (such as renovations to the home, for example), the sales history reflects current market supply and demand.
As a seller, it’s essential to ensure your home is accurately priced. Too high and it could sit on the market longer than you’d like. Buyers may scroll past your listing, open homes could become quiet, and you may be forced to have a price cut just to sell the property. Too low and you could lose a lot of money, which you could have used to fund your next property purchase or even reduce your mortgage.
As a buyer, you don’t want to overpay for a property! Any purchase is an investment that should hold or increase its value over time. However, the market is a competitive place, and as a buyer, you need to ensure your offer/bid is relevant for it to be seriously considered.
As an investor, you need to assess a property’s market value before adding it to your growing portfolio. Don't just look at the property's listing price, you also have to check if price growth for properties in a specific suburb has been steady across a few market cycles before committing to a sale.
In all of the above cases, a simple property sales history search is the way to go!
Sign up to access Landchecker
Access property sales data including last sold price and historical sales for residential and commercial property.
When is the best time to look for property sales history?
In almost every case, a search should be performed prior to buying or listing a property for sale – even if you’re not at the stage of selling and just want an idea.
Before making an offer, you need to study the property’s sale history to know how its value has changed over time, so you’ll have additional information to ensure you’re making the most informed decision possible and strengthen your negotiating power. If a property has suddenly experienced a significant change in value (higher or lower), especially over a short period, you can enquire as to why. By performing this due diligence, it also provides you with peace of mind and enhanced confidence when it comes to putting forth an offer you can feel comfortable with.
Before setting a listing price, the sales history data will be used to determine how much your home might be worth and set a fair market price. You’ll have the exact foundation and comparative information from surrounding properties to back up the price point/price range. You can then create a sales history report and share the information with prospective buyers to better guide them in their decision-making process.
When assessing an investment opportunity, a sales history can make or break your investment, as it can show the property’s condition and ownership. You can also use it for sales forecasting so you have an idea of the property’s market value, future sales, and potential investment risks. It can be the base for your investment decisions.
When something looks too good (or too bad) to be true, you may look at the property’s sales history to spot potential red flags, including consistent decline in sale prices, properties being sold for significantly less than the previous price and frequent sales within a short amount of time. If you spot these trends, you can investigate the past ownership or check for possible damage to the property.
What Sales History Actually Includes
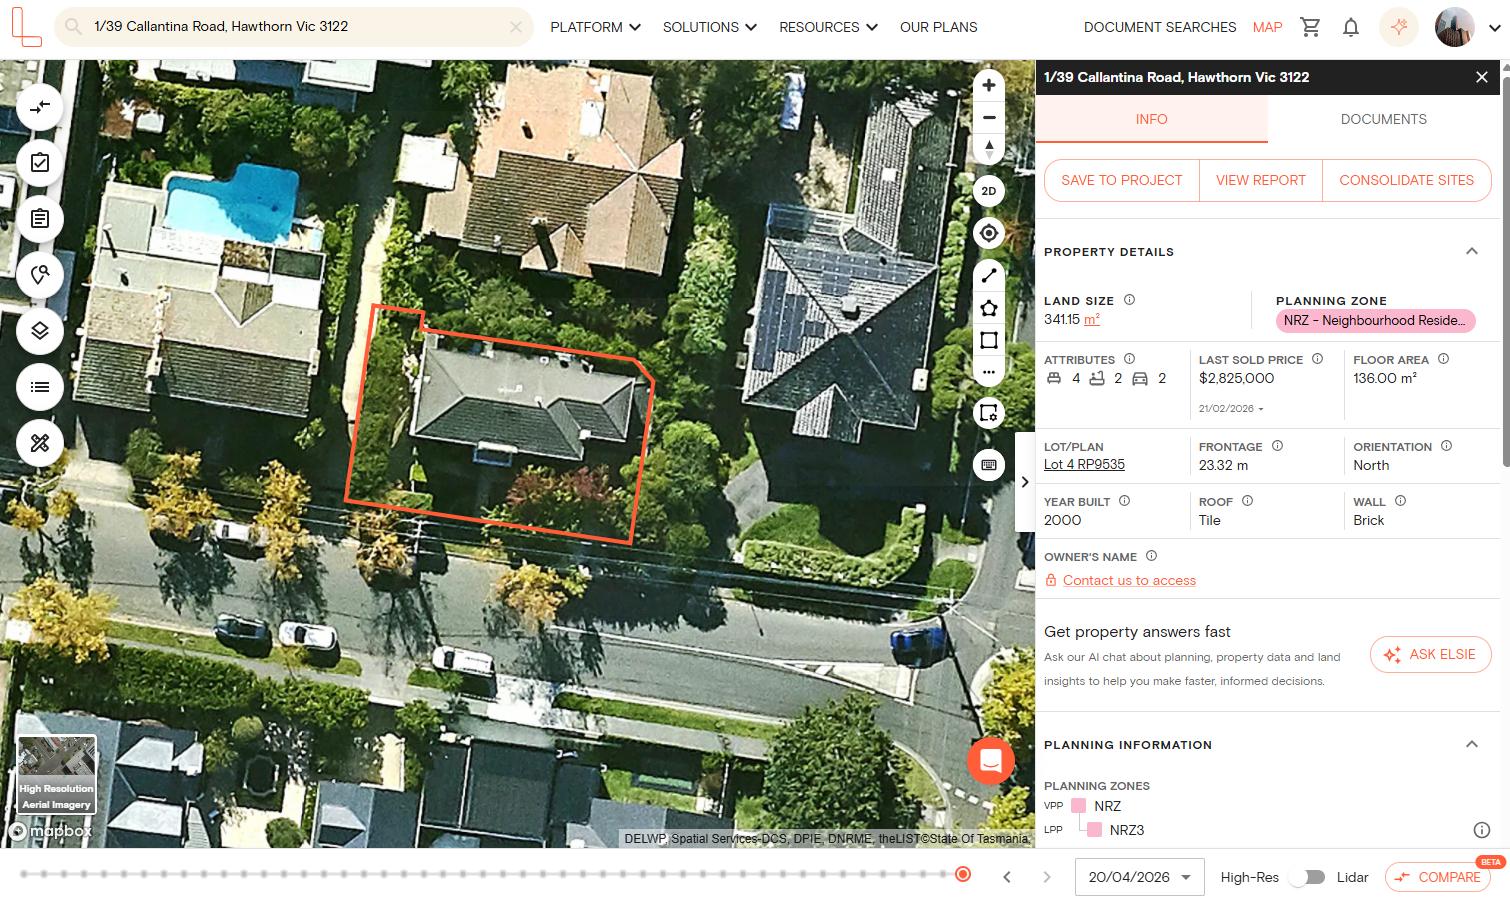
A sales history typically contains general property history information, which can include when the property was built, its floor plan, local government and suburb insights. Key information includes sale/purchase prices and dates. It can also include a more comprehensive summary of the property that includes the property’s permit history information and the most accurate, reliable and up-to-date data sets.
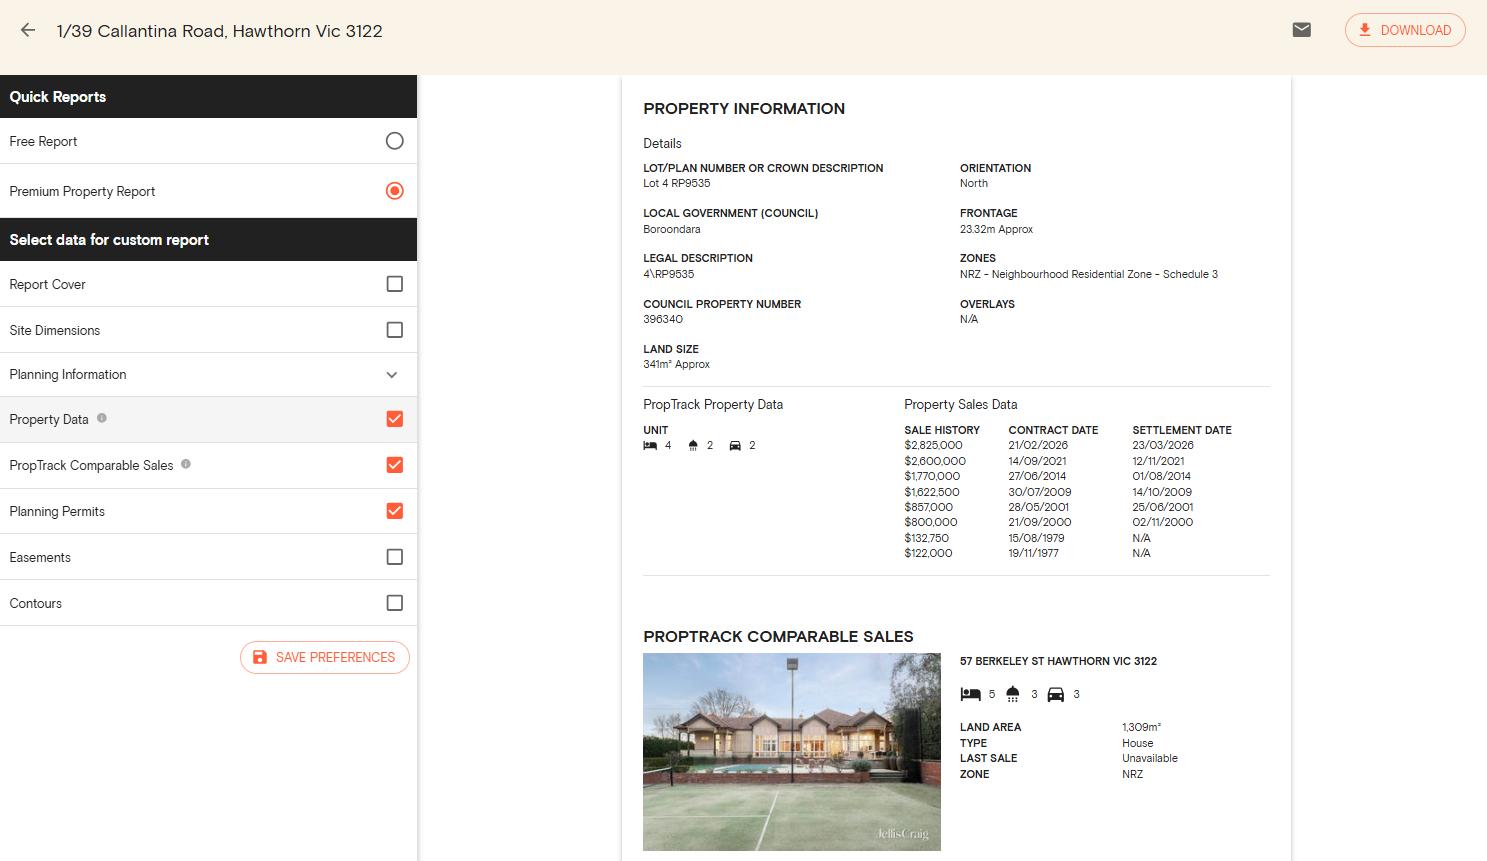
1. Sale Price And Date
The sale price and date refer to the property’s final settlement price and the transaction timing. By comparing past sale prices and dates, you can identify whether the sale trend is steady, seasonal or affected by specific events. Then you can use the data you’ve gathered to guide you on when it’s the right time to buy or sell a property based on where it is in its market cycle.
2. Land Size
The land size refers to the total area a property occupies, including the house, yard, driveway, patios, pools and other additional features. The land size is typically calculated from the cadastral map. While it may look like a small detail, knowing the land size matters as it affects a property’s market value, future investment potential, and overall appeal. Properties with larger land sizes are often more desirable as they can be split into smaller parcels for resale or offer additional space for future development.
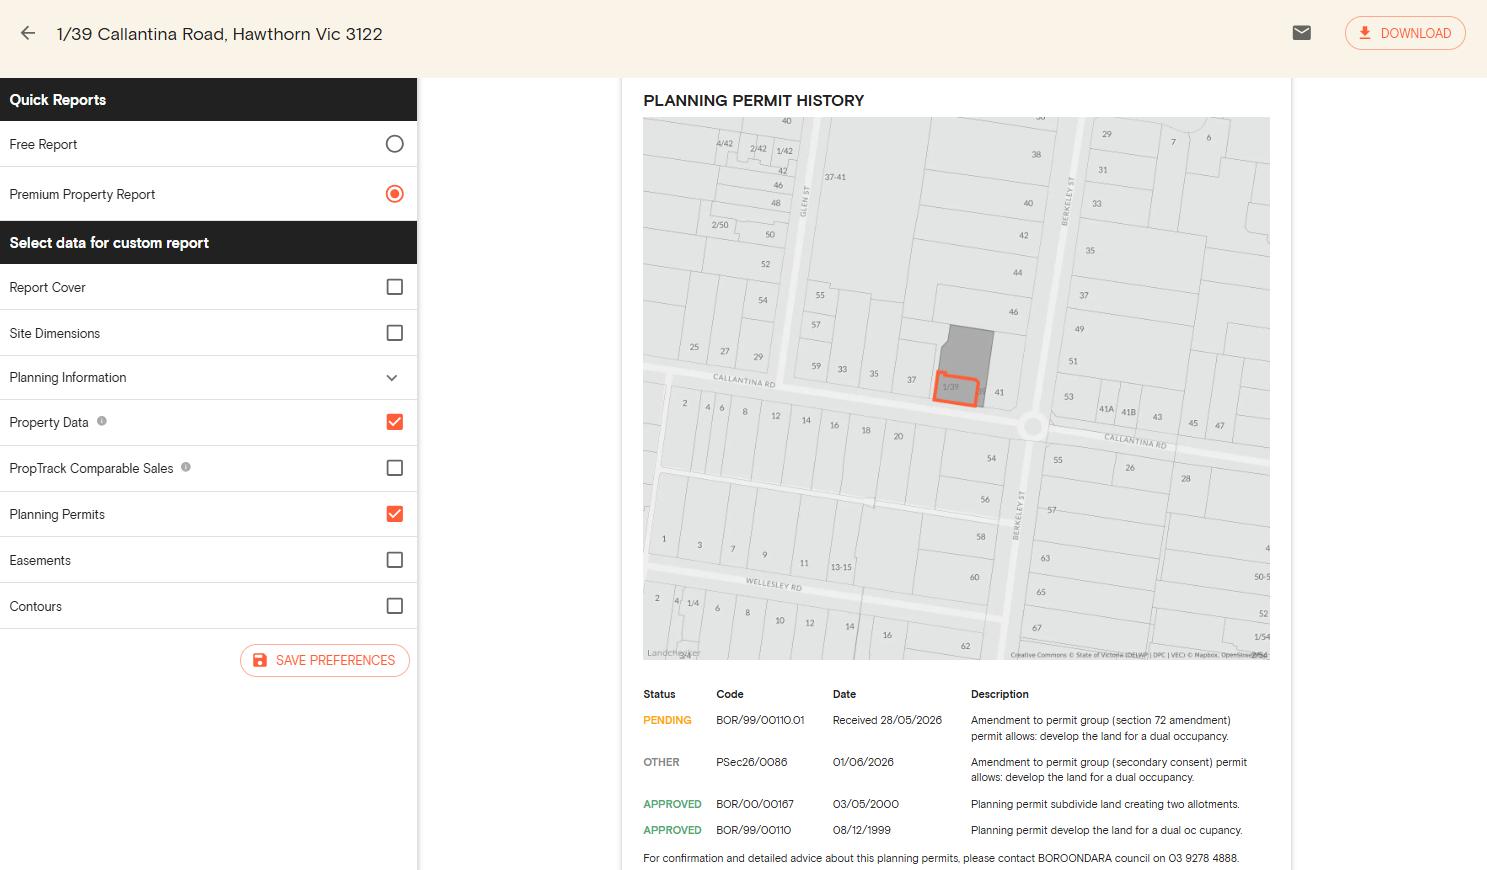
3. Permit History
Permit history is also helpful so you know what restrictions you may face in the future around planning and building extensions, requiring council approval, etc. A permit history also confirms the major repairs done on the property, such as electrical work, alterations to the front facade or replacement of the rear roof material. Permit activity is a common question buyers want to know about, so you will be informed should this pop up.
4. Zoning Information
Zoning information specifies the rules, regulations, and state or local laws put in place to control how a specific parcel of land or property can and cannot be developed. It also determines whether a specific piece of land or property can be used for residential, commercial, agricultural, or industrial purposes, among others.
5. Planning Overlays
Planning overlays are used in urban planning to manage specific geographic areas based on their unique environmental, historical or infrastructural characteristics. These overlays apply additional controls and guidelines on top of the base zoning to address issues such as flood risk, heritage conservation, environmental protection, and landscape preservation.
For buyers, these details can help determine what the property might be worth (not just now, but in the future). For agents & sellers, this data helps in pricing a property accordingly, based on other comparative recent sales in the area. You can also use these insights to better pre-empt local market trends and demand from this available information.
Landchecker combines sales history, permit/DA data and planning information in one view. Most sources give you the property's price and date; however, Landchecker takes it to the next level by giving you context around why prices moved through up-to-date property data, such as zones, overlays, flood and bushfire in context to your property or area. Further, you can access key features including document searches, property reports, permit/DA information, land size and property dimensions, all in one place.
How to Read and Interpret the Data
After gathering the sales history, the next step is to read and interpret the data so you can use it to buy or sell properties effectively. You can read on below for some tips on how to read and interpret sales history data.
1. Focus on analysing the trend, not just the property’s price
A residential property has been sold four times in the last 12 years, and all transactions show a slow and steady price increase throughout the sales dates. This may indicate a demand for the property rather than just a seasonal or one-off market spike.
However, if there are long gaps between sales, this might indicate that the property has remained unsold for a while or that there has been stagnation in the market.
Finally, if you found multiple sales transactions during a short time span, this could also prompt you to investigate the matter further, as it can be a signal that there is something wrong with the property, like property defects or high utility bills.
2. Compare against suburb trends
The suburb median is the most common metric used for property evaluation in Australia, which could also affect the decisions of investors, lenders, and even government policies. It serves as a baseline indicator of market health, affordability, and investor sentiment for a specific neighbourhood.
If you're only looking at the sales history of a single property, you may not get the whole story. Another part of the equation comes from the suburb median. A property with an increase in value of 20% from 2018 to 2022 will appear very different when comparing it to the same median suburb price with an increase in value of 40% in the same period.
This is because a property that performed below average could be the issue with that specific property and not the market condition. Comparison of the history of a property and the suburb median prices and market conditions will require a Comparative Market Analysis (CMA).
3. Let the permit history explain the price
Reviewing the permit history gives you an idea of the property’s development potential, legal compliance and structural risk. Permit history shows when the house was built, what the original configuration was, and how it’s changed over time.
If you found work done on the property without permits, this could create disclosure obligations when you sell in the future or the renovation was not built to code, which could create safety risks.
4. Common things people misread
Comparing properties without adjusting for land size. More land does not instantly mean more property growth. Large plots could mean a higher purchase price and a lower yield, so it’s important to consider the land size when comparing properties.
Not recognising inter-family transfers. A property that "sold" well below market rate may have transferred between family members, common in estate situations. That figure will skew your read on price history if you take it at face value.
Treating every price drop as a problem. Some people assume a price drop means a problem when it might be a market condition. Check what comparable properties were doing in the same period before concluding.
Where to find property sales history
1. State government land registries collect and publish real estate market data. You can check official government portals to check a property’s past sales prices, transaction dates and certificate of titles.
Depending on where your property is located, you can visit:
NSW Land Registry Services (LRS)
South Australian Integrated Land Information System (SAILIS)
Australian Capital Territory Land Information System (ACTLIS)
2. Property listing sites and public records are one avenue you can go down. The issue here is that information is often fragmented/incomplete. Commonly, if the property hasn’t been sold for some time, it can be hard to find updated information.
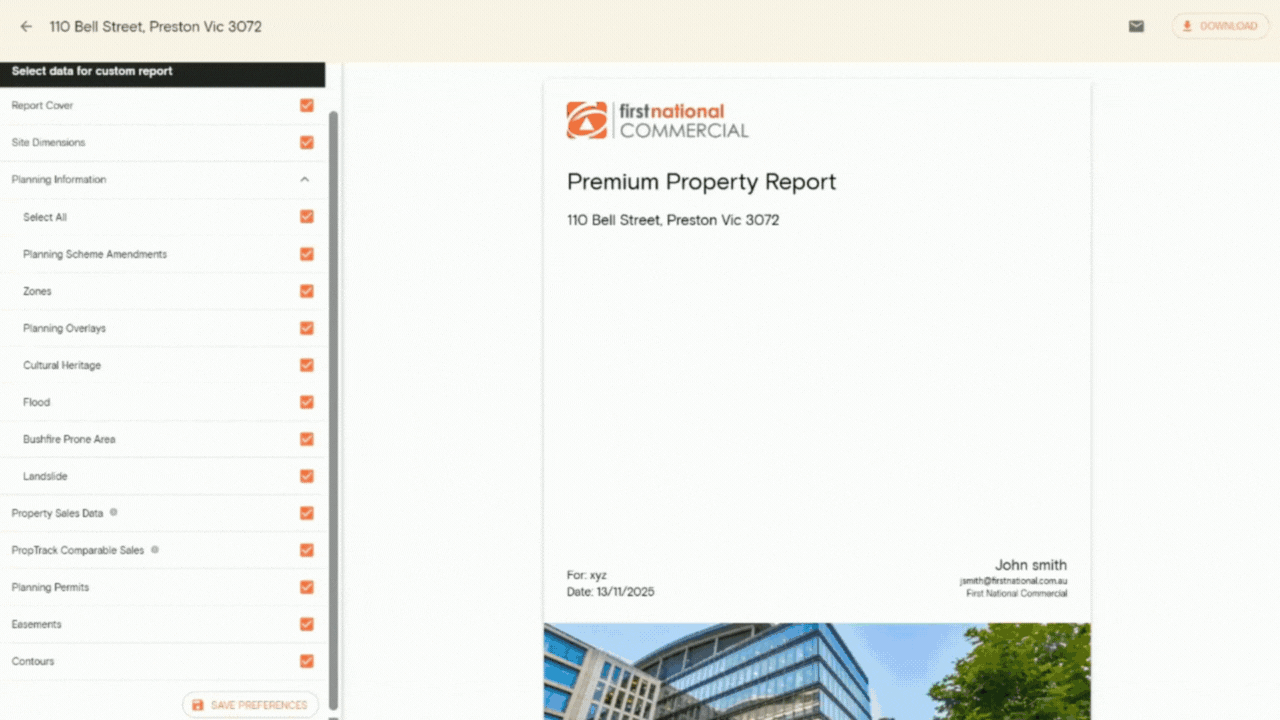
3. Dedicated property data platforms such as Landchecker offer a premium property report that is quick and simple to generate.
What Sales History Doesn’t Tell You
Sales history is a powerful tool for making smarter decisions, but some essential factors may not show in the data. Here are some items to consider that may not show up in a sales history report:
Off-market sales. Sales history does not show off-market sales, transactions where properties are sold without being listed in online portals, such as realestate.com or Domain. These types of listings are shared directly with selected buyers for convenience, discretion and efficiency. Once sold, the transaction appears in official records and the property is given a title. Since the property was not marketed publicly, you may not find the listing data, and you won’t have context for how long it was marketed.
Property condition. It’s typically excluded from a sales history since property condition can be subjective. Conduct a building inspection to determine the condition of the property before buying or selling it.
Non-arm's-length transactions. These are business deals between buyers and sellers with an existing relationship that is either business-related or personal, which can show prices well below market value. Non-arm’s length transactions include a parent selling a home to their child, business partners transferring real estate to each other, and renting a commercial property to a sibling. If a property’s sale price looks unusual, it pays to check if both parties share a surname.
A sales history is a great starting point for due diligence, but it should not replace professional advice. If you’re doing formal finance valuations, it’s recommended to engage a registered valuer. For assessing property conditions, reach out to a trusted building and pest inspection company. For title, easements and legal encumbrances, contact a conveyancer or solicitor.
How different audiences use sales history data
For buyers, sales history can be used to look at the price trends, comparable sales nearby and permit history for renovation clues. These details can help determine what the property might be worth (not just now, but in the future).
For agents & sellers, this data can help price properties accordingly, based on other comparative recent sales in the area. You can use comparable sales to filter by price, proximity, property type and land area. You can also use these insights to better pre-empt local market trends and demand from this available information
For investors, sales history can be used to identify growth corridors, assess yield, spot areas where permit activity signals development and future value changes.
For valuers & legal, where comprehensive data (sales + permits + planning) is essential for formal assessments
Landchecker’s sales history data is sourced from state government, local councils and partners. It's monitored and refreshed on a schedule matched to each dataset as soon as it’s received to keep it aligned with our sources.
| Dataset | Update Frequency |
|---|---|
| Address | Daily (NSW & VIC), Weekly (QLD, ACT, SA, WA, TAS), Monthly (NT) |
| Parcel/Property Identifier | Daily (NSW & VIC), Weekly (QLD, ACT, SA, WA, TAS), Monthly (NT) |
| Land Size | Daily (NSW & VIC), Weekly (QLD, ACT, SA, WA, TAS), Monthly (NT) |
| Frontage | Monthly |
| Orientation | Monthly |
| Zone | Weekly, Monthly (NT) |
| Permits/Development Applications | Daily |
| Easements | 1st & 3rd Monday of the month |
| High Resolution Imagery | Quarterly |
| Hazards: Flood, Bushfire, Acid Sulphate, Landslide | Weekly (NSW, VIC, QLD, ACT, SA, TAS) |
| Planning Layers | Weekly (NSW, VIC, SA), Monthly (QLD) |
| Overlays | Weekly (VIC, ACT, SA), Monthly (QLD) |
The report includes neighbourhood information, recent and proposed planning scheme amendments, imagery and much more.
There’s also no need to waste time digging for the data you need – Landchecker pulls together all the information in one thorough, summarised document (so you don’t have to!).
Quick and easy to read property sales history searches are available across properties in NSW, VIC, QLD, SA, WA, ACT, NT and TAS for less than $20 (and it’s downloadable in just seconds).
Next Steps:
Now that you know what to look for in a property's sales history, you can access this data for any property across NSW, VIC, QLD, SA, WA, and TAS. Sign up for free today to discover more at app.landchecker.com.au/join