Product Help
How to conduct a desktop site assessment using high-resolution aerial imagery
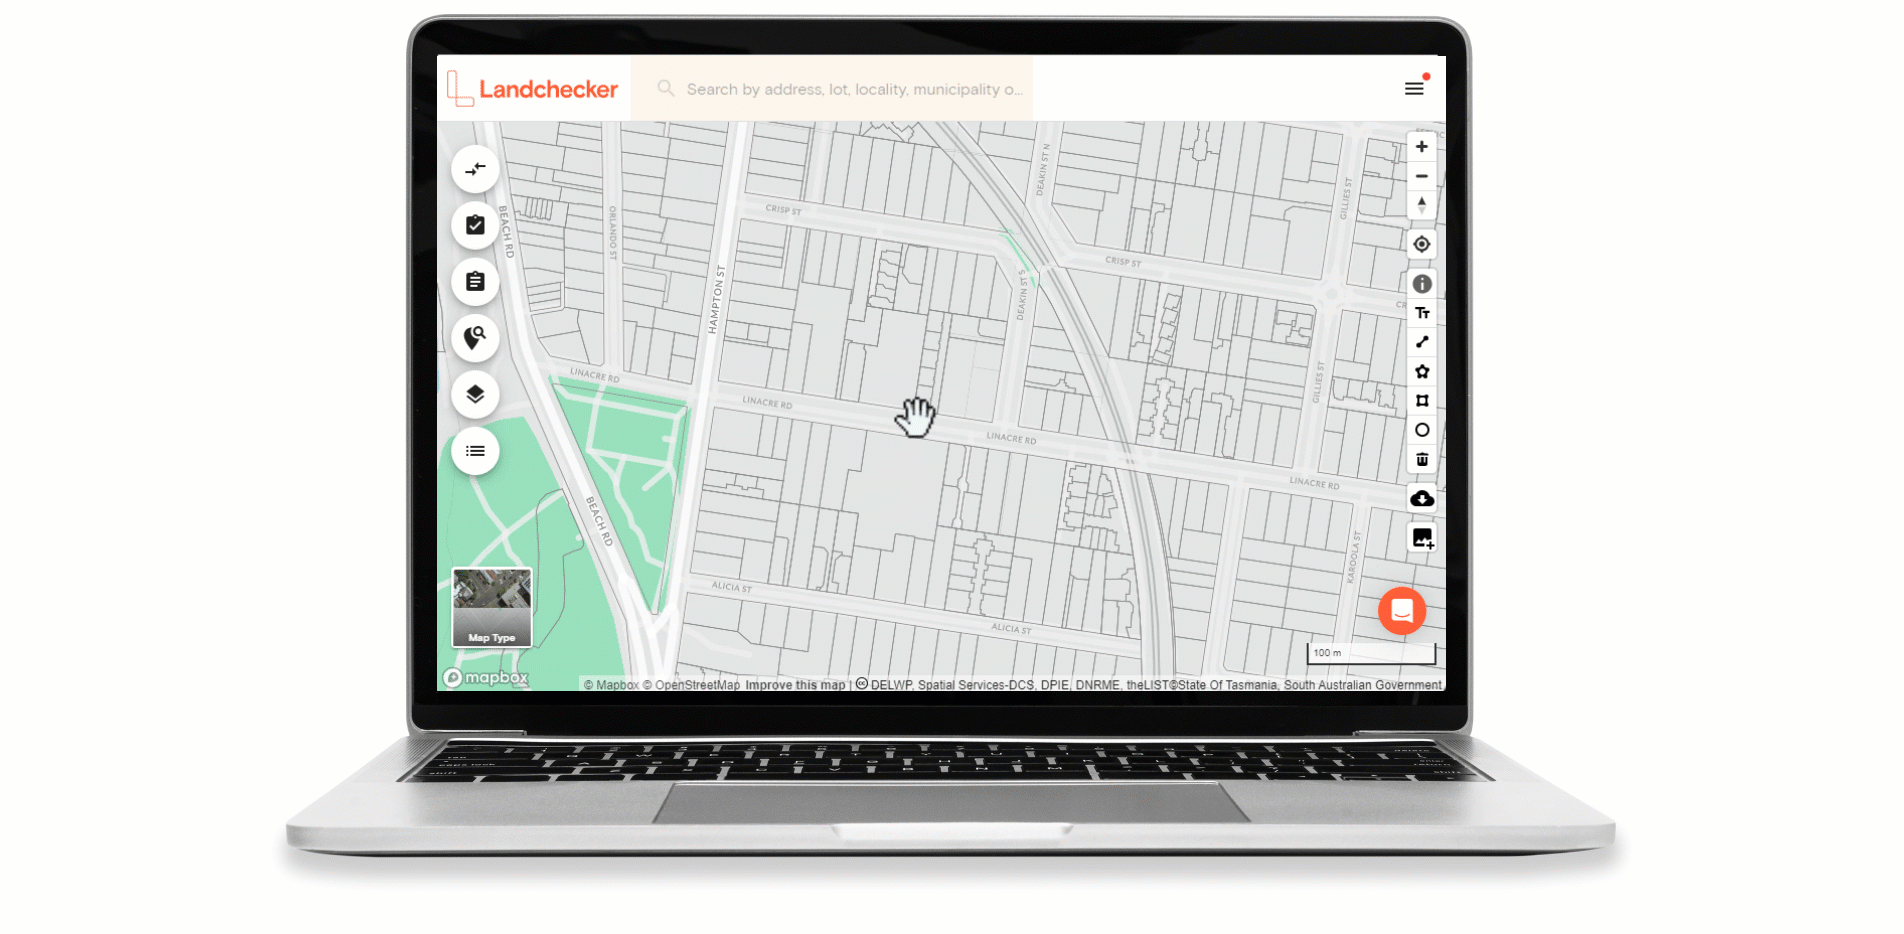
Landchecker combines high-resolution aerial imagery with rich property data, creating an all-in-one tool for conducting desktop site assessments. View recent and past imagery, together with comprehensive planning information, sales data and more.
Watch the video or follow the step-by-step instructions below to find out how to conduct a desktop site assessment using the high-resolution aerial imagery tools in Landchecker.

1. Turn on the high-res aerial imagery
Click Map Type in the bottom left-hand corner. Select high-res aerial imagery. If the high-res option is locked, please contact your Admin to assign permissions to your account.
2. Use the timeline to view past images
Click the timeline in the bottom right-hand corner. Please note, the timeline will only be visible when you have high-res aerial imagery turned on (see step above). Select the drop-down list to view past imagery to see how the property or suburb has changed over time.
Dates in red indicate that the image is a near-infra-red (NIR) image, to help you to view vegetation vigour. This may be useful if you are viewing high-res imagery for the management of parks and gardens, irrigation systems, agriculture etc.
3. Measuring tools
On the right-hand side of the screen are a number of tools, including measurement tools.
The icon shaped like a star will measure the area of any shape and is the most popular measuring tool. Select the Any Shape tool, click the corners of the shape you would like to measure, and double click to complete the measurement. There is also a tool to measure distance and circumference.
Click the Tt icon to add a text label to the map.
4. Export options
Click the icon at the very bottom of the right-hand side toolbar to activate the high-resolution aerial image export.
Select the image on the map you would like to export. If the area is shaded green, this indicates the exported image will be high-quality. If the shaded area is orange or red it indicates the exported image will be medium or low quality. To rectify this, zoom in, or draw a smaller rectangle.
There are a number of export options including JPEG or PNG. Select a geo-referenced image and a projection option to export the image for a CAD or BIM package.
5. Check additional property information
Simply click on a property or search for an address to open up the property panel.
The property panel includes comprehensive property information such as the land size, the number of bedrooms and bathrooms, sales history and planning information. You can even view links directly to the relevant planning scheme schedules.
Use the Distance-To tool with intelligent routing technology to view how far you can walk, bike and drive within a specified time frame.
Check Council Information to get the local government's contact details, such as phone number, email and website.
Select School Information to check a list of nearby private, primary and secondary schools in a specific area.
Click the square on the Google Street View thumbnail to expand the view. Use the arrows to ‘walk’ down the street.