Yandina QLD 4561
This Yandina suburb profile includes demographic data and planning information to help you make an informed property decision.
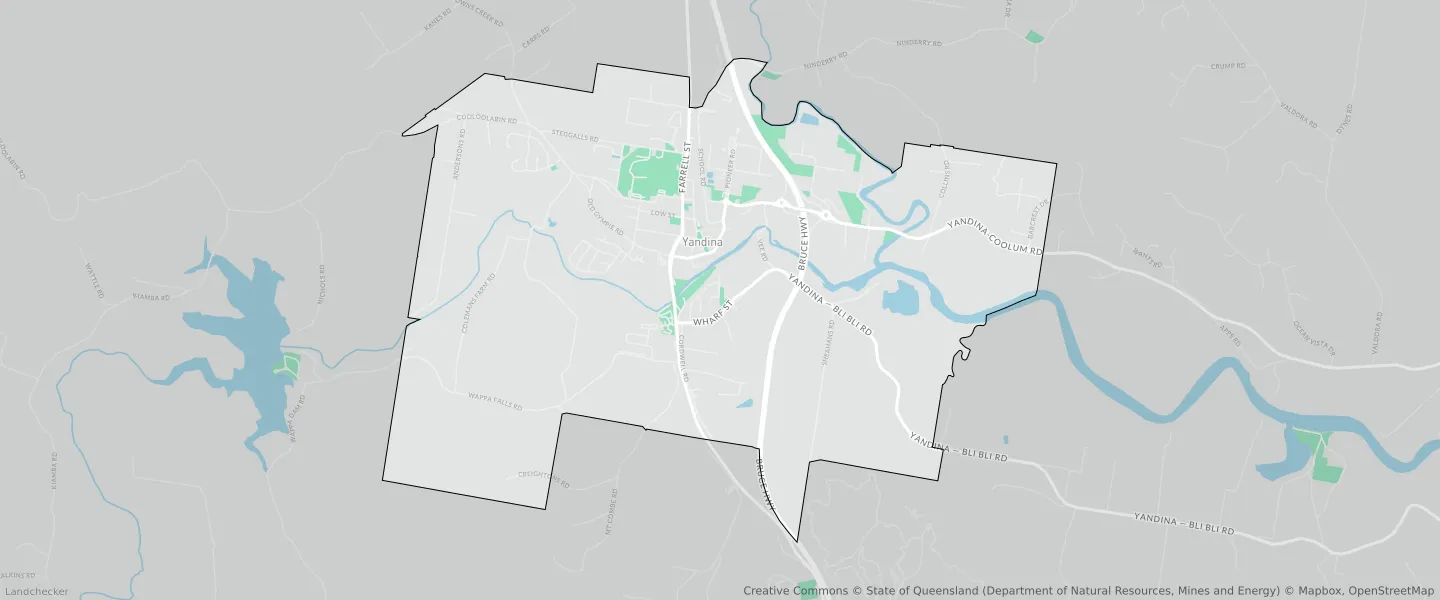
An average home in Yandina is owned with a mortgage by couples with children. The average age in Yandina is 36. Separate houses are common in Yandina and the area is mostly Rural (55.01%), Low Density Residential (9.85%) and Environmental Management and Conservation (5.79%).
Yandina demographics
Population
3073
Average Age
36
Age Distribution
Employment Type
Median Weekly Income
Traveled to Work
Car
88.3%
Tram
0.0%
Bicycle
0.0%
Train
0.0%
Walking
2.3%
Bus
0.4%
Yandina property information
Number of Bedrooms
Tenure Type
Property Types in Yandina
Separate house
Semi detached house
Unit/Apartment
Median monthly mortgage repayments
$1,807
Median weekly rental payments
$369
Average number of bedrooms per dwelling
3.2
Average number of people per household
3
Household Composition
Family Composition
Couple family without children
One parent family
Couple family with children
YANDINA planning zones
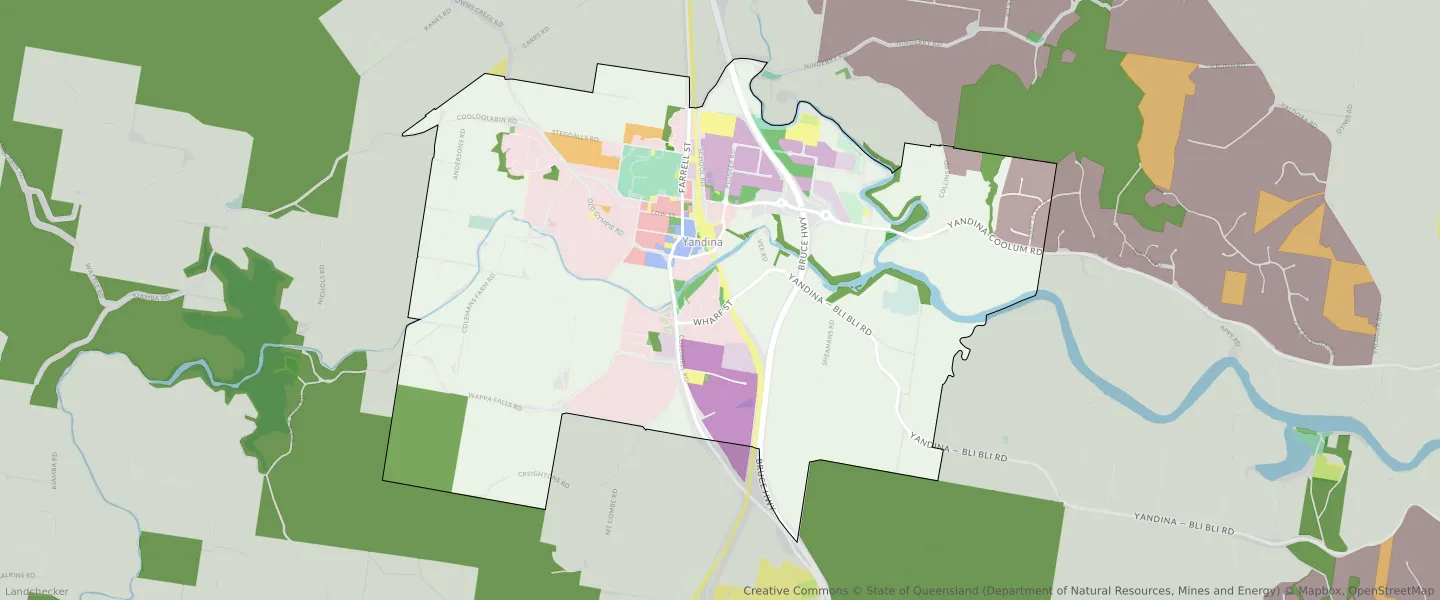
| Zone Code | Zone Name | Percentage Covered | Area Covered | |
|---|---|---|---|---|
| COMMUNITY FACILITIES | Community Facilities | 1.85% | 284,407.84㎡ | |
| ENVIRONMENTAL MANAGEMENT AND CONSERVATION | Environmental Management and Conservation | 5.79% | 891,397.5㎡ | |
| HIGH IMPACT INDUSTRY | High Impact Industry | 2.24% | 345,719.57㎡ | |
| LIMITED DEVELOPMENT (LANDSCAPE RESIDENTIAL) | Limited Development (Landscape Residential) | 0.26% | 39,846.43㎡ | |
| LOCAL CENTRE | Local Centre | 0.49% | 75,472.94㎡ | |
| LOW DENSITY RESIDENTIAL | Low Density Residential | 9.85% | 1,516,636.18㎡ | |
| LOW IMPACT INDUSTRY | Low Impact Industry | 1.16% | 178,964.37㎡ | |
| MEDIUM DENSITY RESIDENTIAL | Medium Density Residential | 0.85% | 131,396.17㎡ | |
| MEDIUM IMPACT INDUSTRY | Medium Impact Industry | 2.13% | 327,507.53㎡ | |
| OPEN SPACE | Open Space | 0.92% | 142,025.75㎡ | |
| RURAL | Rural | 55.01% | 8,472,701.38㎡ | |
| RURAL RESIDENTIAL | Rural Residential | 2.27% | 350,132.46㎡ | |
| SPORT AND RECREATION | Sport and Recreation | 1.43% | 220,049.4㎡ |
Looking to research a property in YANDINA?
Go to mapData Source - ABS