Woongarrah NSW 2259
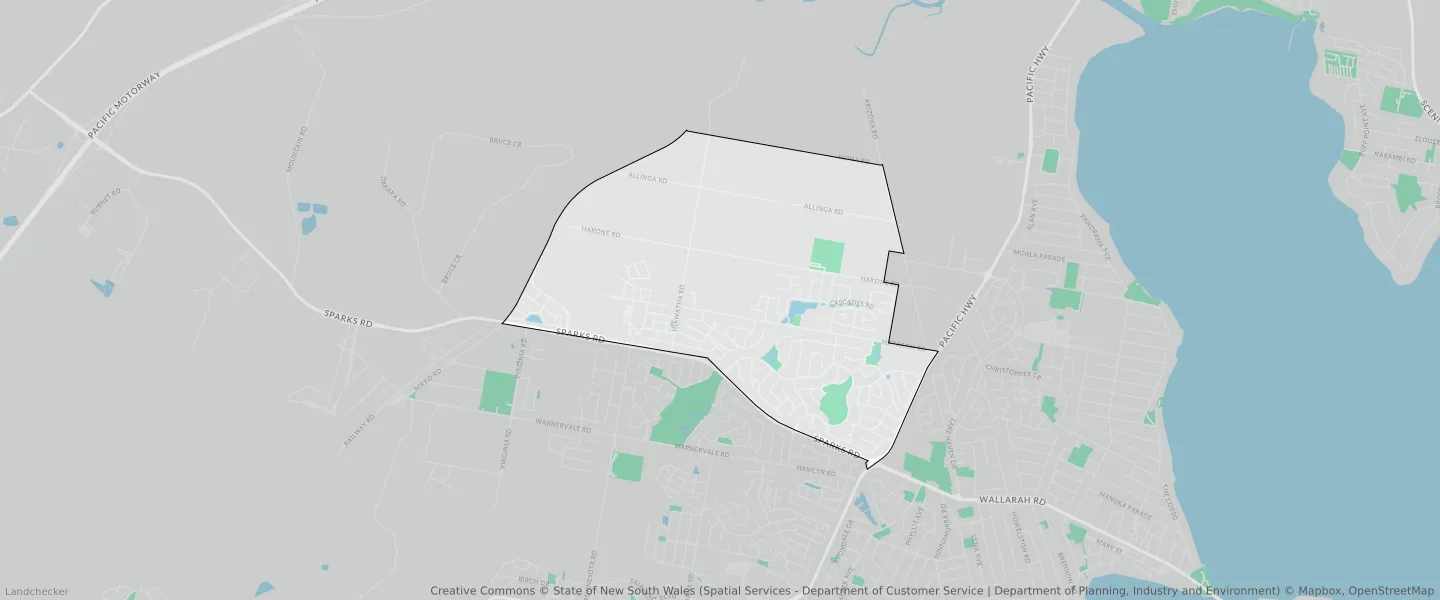
This Woongarrah suburb profile includes demographic data and planning information to help you make an informed property decision.
An average home in Woongarrah is owned with a mortgage by couples with children. The average age in Woongarrah is 36. Separate houses are common in Woongarrah and the area is mostly Transition (41.25%), Environmental Living (32.3%) and General Residential (12.16%).
Woongarrah demographics
Population
5962
Average Age
36
Age Distribution
Employment Type
Median Weekly Income
Traveled to Work
Car
87.4%
Tram
0.0%
Bicycle
0.0%
Train
0.4%
Walking
1.2%
Bus
0.5%
Woongarrah property information
Number of Bedrooms
Tenure Type
Property Types in Woongarrah
Separate house
Semi detached house
Unit/Apartment
Median monthly mortgage repayments
$2,167
Median weekly rental payments
$510
Average number of bedrooms per dwelling
4.0
Average number of people per household
3
Household Composition
Family Composition
Couple family without children
One parent family
Couple family with children
WOONGARRAH planning zones
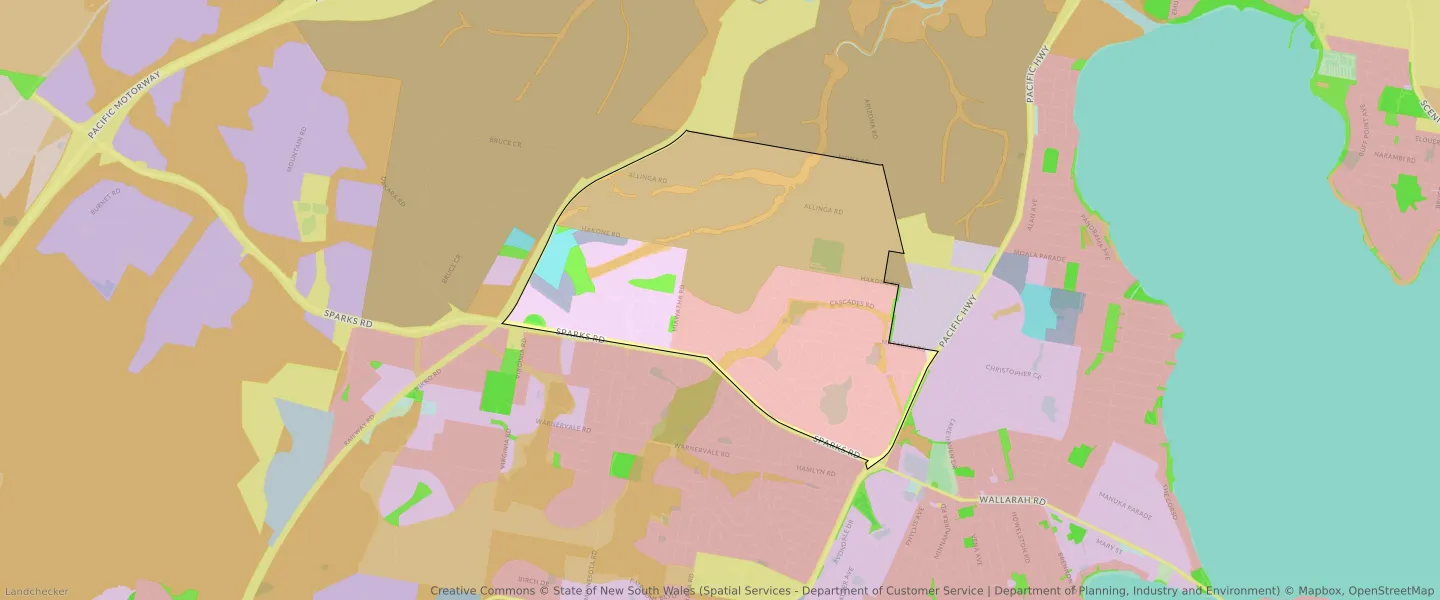
| Zone Code | Zone Name | Percentage Covered | Area Covered | |
|---|---|---|---|---|
| C2 | Environmental Conservation | 6.21% | 327,943.32㎡ | |
| C3 | Environmental Conservation | 0.33% | 17,307.34㎡ | |
| E1 | Local Centre | 1.61% | 85,080.94㎡ | |
| E4 | General Industrial | 0.04% | 2,068.98㎡ | |
| MU1 | Mixed Use | 1.2% | 63,130.56㎡ | |
| R1 | General Residential | 12.16% | 642,052.44㎡ | |
| R2 | Environmental Living | 32.3% | 1,705,577.07㎡ | |
| RE1 | Low Density Residential | 2.24% | 118,498.95㎡ | |
| RU6 | Transition | 41.25% | 2,178,053.17㎡ | |
| SP2 | Infrastructure | 2.66% | 140,519.52㎡ |
Looking to research a property in WOONGARRAH?
Go to mapData Source - ABS