Woolooware NSW 2230
This Woolooware suburb profile includes demographic data and planning information to help you make an informed property decision.
An average home in Woolooware is owned with a mortgage by couples with children. The average age in Woolooware is 39. Separate houses are common in Woolooware and the area is mostly Environmental Living (36.76%), Low Density Residential (23.2%) and Environmental Living (21.38%).
Woolooware demographics
Population
5060
Average Age
39
Age Distribution
Employment Type
Median Weekly Income
Traveled to Work
Car
85.1%
Tram
0.0%
Bicycle
0.8%
Train
3.7%
Walking
2.8%
Bus
0.5%
Woolooware property information
Number of Bedrooms
Tenure Type
Property Types in Woolooware
Separate house
Semi detached house
Unit/Apartment
Median monthly mortgage repayments
$2,600
Median weekly rental payments
$550
Average number of bedrooms per dwelling
2.8
Average number of people per household
2
Household Composition
Family Composition
Couple family without children
One parent family
Couple family with children
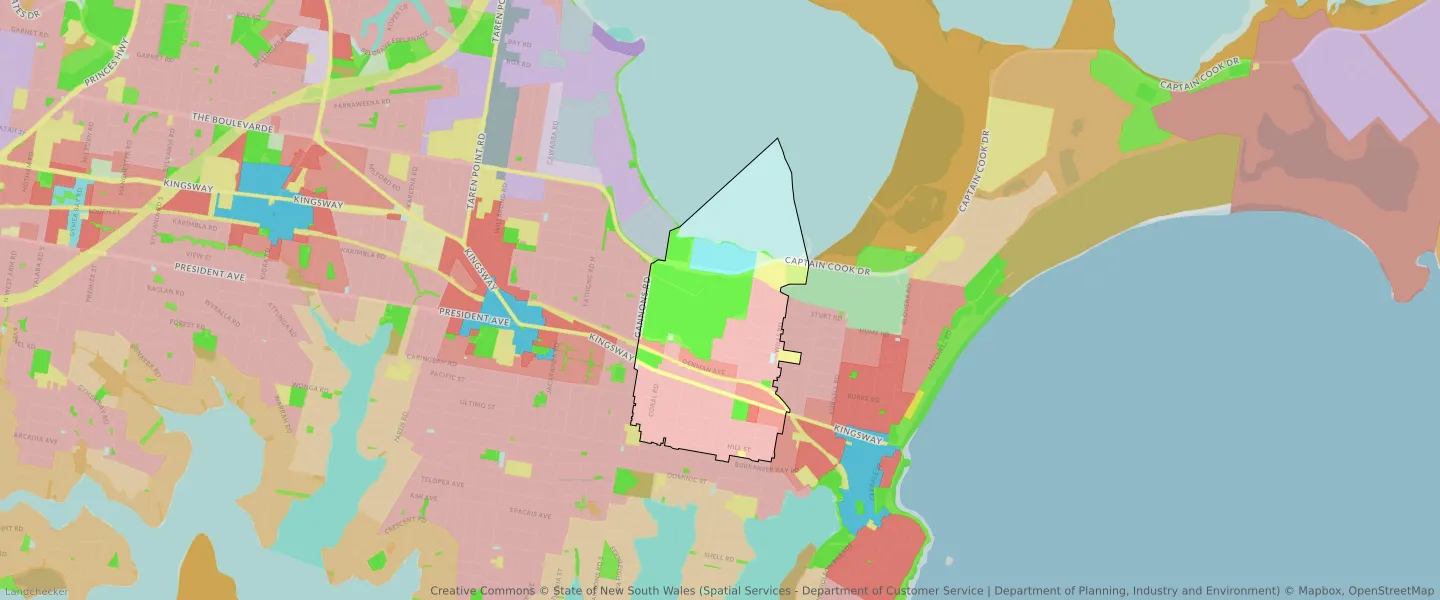
WOOLOOWARE planning zones
| Zone Code | Zone Name | Percentage Covered | Area Covered | |
|---|---|---|---|---|
| C2 | Environmental Conservation | 0.01% | 226.29㎡ | |
| E1 | Local Centre | 5.1% | 121,817.42㎡ | |
| R2 | Environmental Living | 36.76% | 878,138.63㎡ | |
| R3 | Medium Density Residential | 5.13% | 122,578.31㎡ | |
| R4 | High Density Residential | 0.46% | 11,062.16㎡ | |
| RE1 | Low Density Residential | 23.2% | 554,233.03㎡ | |
| RE2 | Private Recreation | 1.03% | 24,640.56㎡ | |
| SP2 | Infrastructure | 6.93% | 165,584.02㎡ | |
| W1 | Environmental Living | 21.38% | 510,690.13㎡ |
Looking to research a property in WOOLOOWARE?
Go to mapData Source - ABS