Wirlinga NSW 2640
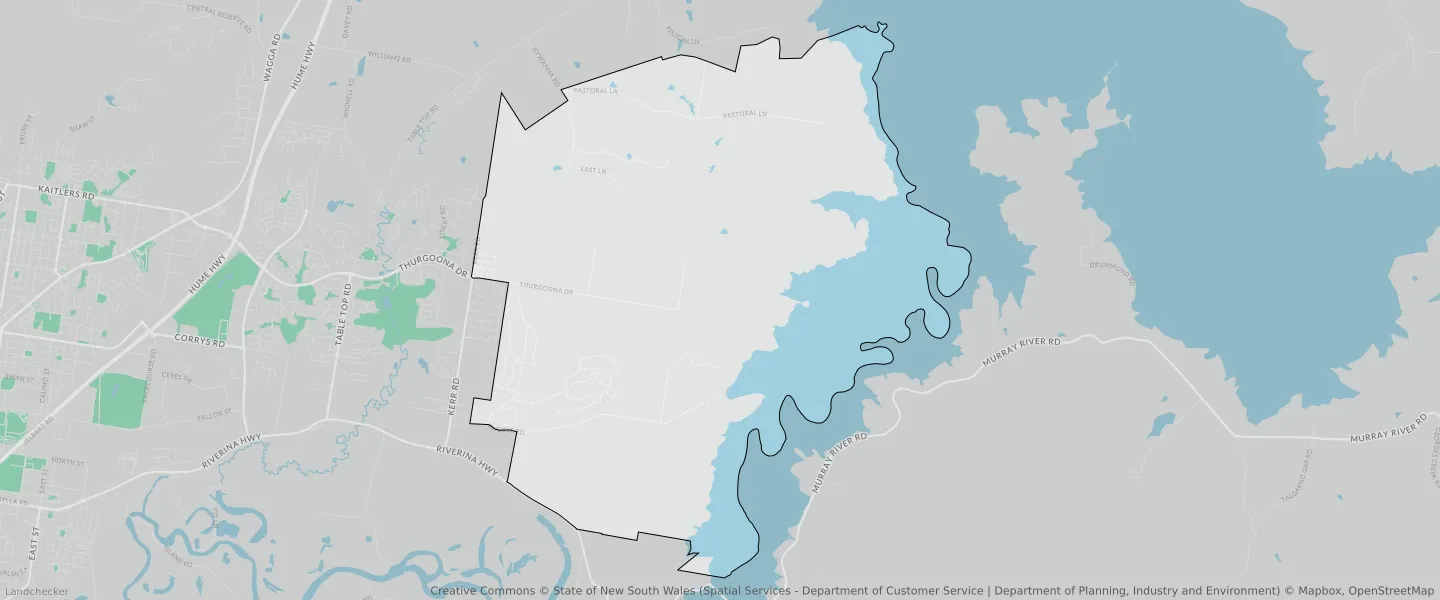
This Wirlinga suburb profile includes demographic data and planning information to help you make an informed property decision.
An average home in Wirlinga is owned with a mortgage by couples with children. The average age in Wirlinga is 30. Separate houses are common in Wirlinga and the area is mostly Environmental Conservation (36.67%), Large Lot Residential (22.08%) and Recreational Waterways (18.41%).
Wirlinga demographics
Population
395
Average Age
30
Age Distribution
Employment Type
Median Weekly Income
Traveled to Work
Car
94.2%
Tram
0.0%
Bicycle
0.0%
Train
0.0%
Walking
2.3%
Bus
0.0%
Wirlinga property information
Number of Bedrooms
Tenure Type
Property Types in Wirlinga
Separate house
Semi detached house
Unit/Apartment
Median monthly mortgage repayments
$1,800
Median weekly rental payments
$340
Average number of bedrooms per dwelling
3.8
Average number of people per household
3
Household Composition
Family Composition
Couple family without children
One parent family
Couple family with children
WIRLINGA planning zones
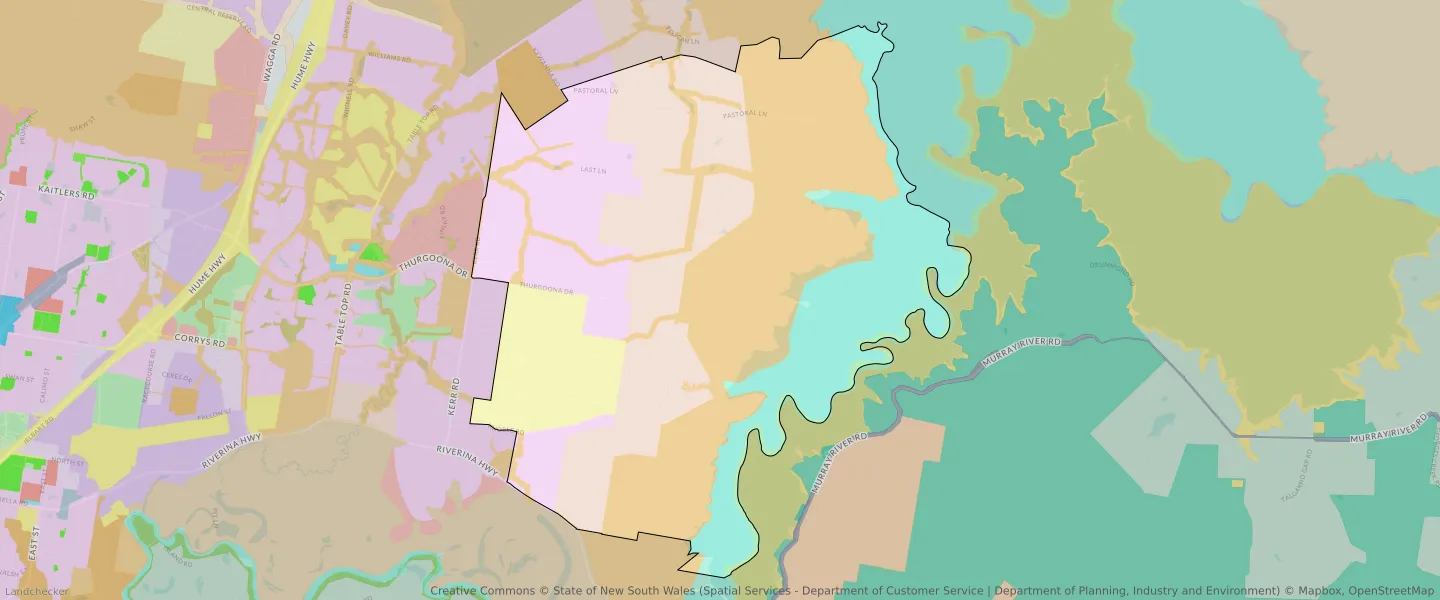
| Zone Code | Zone Name | Percentage Covered | Area Covered | |
|---|---|---|---|---|
| C2 | Environmental Conservation | 0.04% | 15,442.09㎡ | |
| C3 | Environmental Conservation | 36.67% | 15,253,306.32㎡ | |
| R1 | General Residential | 16.27% | 6,769,607.21㎡ | |
| R5 | Large Lot Residential | 22.08% | 9,186,425.77㎡ | |
| RU2 | Rural Landscape | 0.02% | 10,120.54㎡ | |
| SP1 | Infrastructure | 6.34% | 2,638,520.29㎡ | |
| W2 | Recreational Waterways | 18.41% | 7,657,305.93㎡ | |
| W2 | Recreational Waterways | 0% | 35.66㎡ |
Looking to research a property in WIRLINGA?
Go to mapData Source - ABS