Warriewood NSW 2102
This Warriewood suburb profile includes demographic data and planning information to help you make an informed property decision.
An average home in Warriewood is owned with a mortgage by couples with children. The average age in Warriewood is 41. Separate houses are common in Warriewood and the area is mostly Medium Density Residential (31.16%), Low Density Residential (15.38%) and Environmental Conservation (12.68%).
Warriewood demographics
Population
8379
Average Age
41
Age Distribution
Employment Type
Median Weekly Income
Traveled to Work
Car
82.4%
Tram
0.0%
Bicycle
1.2%
Train
0.0%
Walking
4.4%
Bus
3.0%
Warriewood property information
Number of Bedrooms
Tenure Type
Property Types in Warriewood
Separate house
Semi detached house
Unit/Apartment
Median monthly mortgage repayments
$3,077
Median weekly rental payments
$750
Average number of bedrooms per dwelling
3.3
Average number of people per household
3
Household Composition
Family Composition
Couple family without children
One parent family
Couple family with children
WARRIEWOOD planning zones
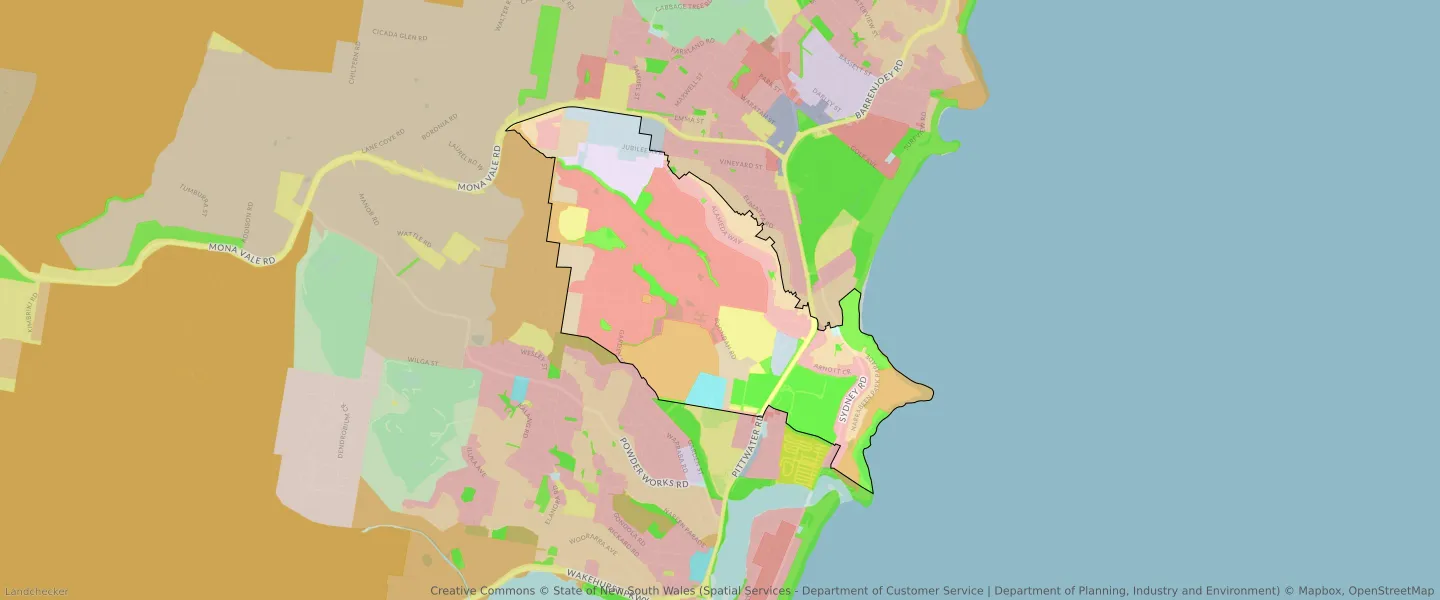
| Zone Code | Zone Name | Percentage Covered | Area Covered | |
|---|---|---|---|---|
| C2 | Environmental Conservation | 12.68% | 528,880.96㎡ | |
| C4 | Environmental Living | 7.45% | 310,945.19㎡ | |
| E1 | Local Centre | 1.8% | 75,188.28㎡ | |
| E3 | Business Development | 0.18% | 7,643.8㎡ | |
| E4 | General Industrial | 4% | 167,003.74㎡ | |
| R2 | Environmental Living | 9.47% | 395,070.84㎡ | |
| R3 | Medium Density Residential | 31.16% | 1,299,566.07㎡ | |
| RE1 | Low Density Residential | 15.38% | 641,688.17㎡ | |
| RU2 | Rural Landscape | 6.51% | 271,642.35㎡ | |
| SP2 | Infrastructure | 6.13% | 255,738.35㎡ | |
| SP4 | Enterprise | 5.22% | 217,764.58㎡ |
Looking to research a property in WARRIEWOOD?
Go to mapData Source - ABS