Walloon QLD 4306
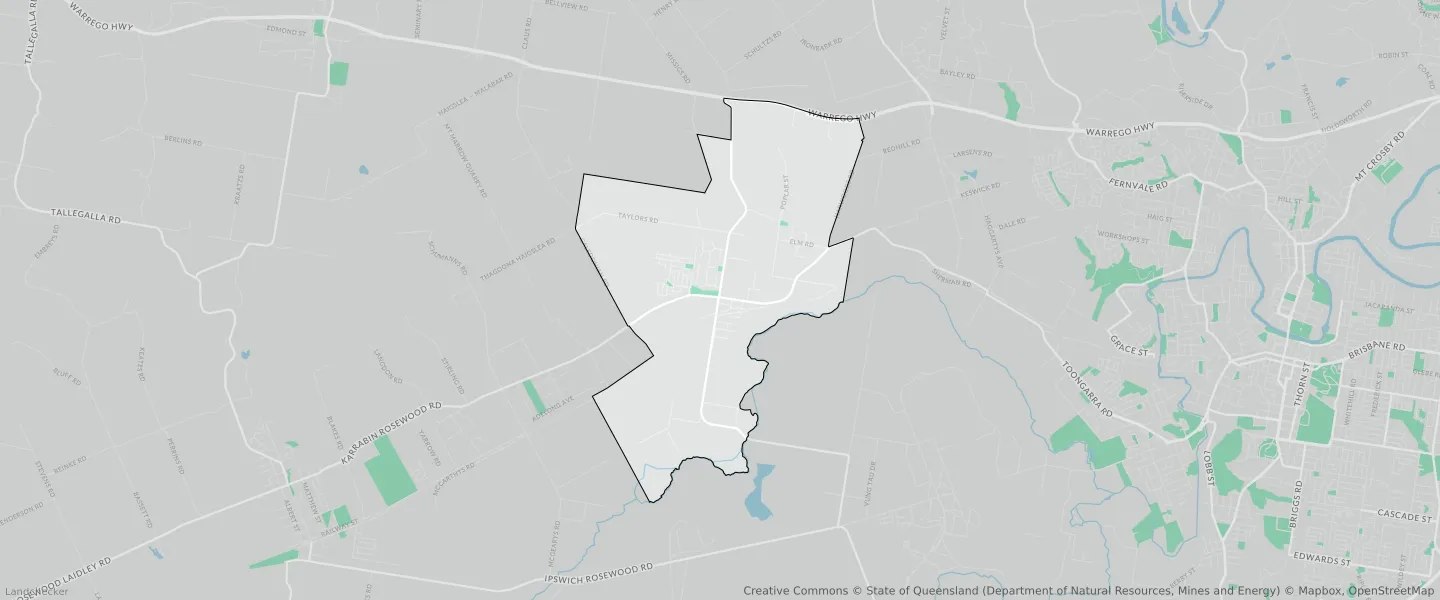
This Walloon suburb profile includes demographic data and planning information to help you make an informed property decision.
An average home in Walloon is owned with a mortgage by couples with children. The average age in Walloon is 35. Separate houses are common in Walloon and the area is mostly EMERGING COMMUNITY (24.26%), RURAL (13.54%) and ENVIRONMENTAL MANAGEMENT (11.69%).
Walloon demographics
Population
2305
Average Age
35
Age Distribution
Employment Type
Median Weekly Income
Traveled to Work
Car
88.4%
Tram
0.0%
Bicycle
0.0%
Train
1.5%
Walking
1.4%
Bus
0.0%
Walloon property information
Number of Bedrooms
Tenure Type
Property Types in Walloon
Separate house
Semi detached house
Unit/Apartment
Median monthly mortgage repayments
$1,647
Median weekly rental payments
$370
Average number of bedrooms per dwelling
3.6
Average number of people per household
3
Household Composition
Family Composition
Couple family without children
One parent family
Couple family with children
WALLOON planning zones
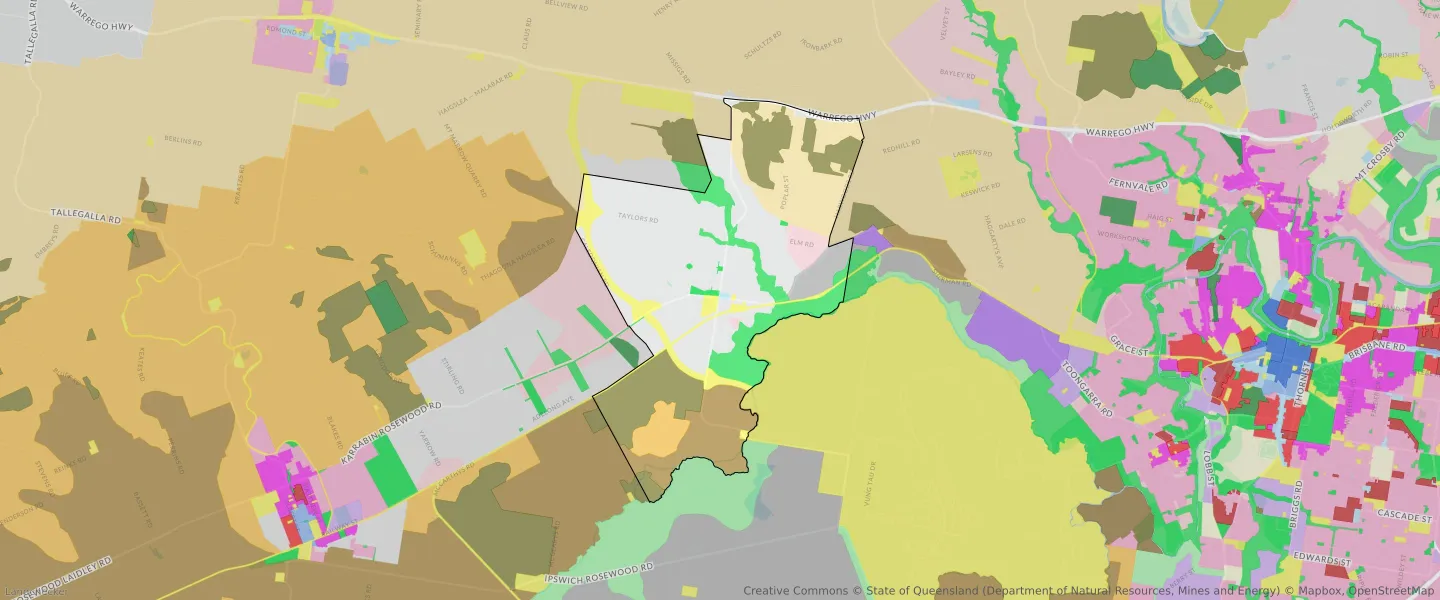
| Zone Code | Zone Name | Percentage Covered | Area Covered | |
|---|---|---|---|---|
| CF | COMMUNITY FACILITIES | 0.34% | 64,943.71㎡ | |
| CON | Conservation | 1.28% | 241,554.57㎡ | |
| DCC | DISTRICT CENTRE | 0.64% | 121,433.37㎡ | |
| DCF | DISTRICT CENTRE | 0.69% | 129,520.72㎡ | |
| EC | EMERGING COMMUNITY | 24.26% | 4,580,086.08㎡ | |
| EM | ENVIRONMENTAL MANAGEMENT | 11.69% | 2,207,024.45㎡ | |
| II | INDUSTRY INVESTIGATION | 2.25% | 425,395.34㎡ | |
| LL | LOW DENSITY RESIDENTIAL | 8.44% | 1,592,563.82㎡ | |
| MD | MEDIUM DENSITY RESIDENTIAL | 1.51% | 285,485.85㎡ | |
| NS | LOW DENSITY RESIDENTIAL | 3.34% | 630,033.76㎡ | |
| R1 | RURAL | 8.31% | 1,569,035.02㎡ | |
| R2 | RURAL | 3.63% | 684,607.56㎡ | |
| R3 | RURAL | 10.52% | 1,985,129.81㎡ | |
| R4 | RURAL | 13.54% | 2,555,764.08㎡ | |
| REC | Recreation | 3.74% | 705,817.5㎡ | |
| SP3 | SPECIAL PURPOSE | 0.99% | 185,997.54㎡ | |
| SP4 | SPECIAL PURPOSE | 4.05% | 765,001.13㎡ |
Looking to research a property in WALLOON?
Go to mapData Source - ABS