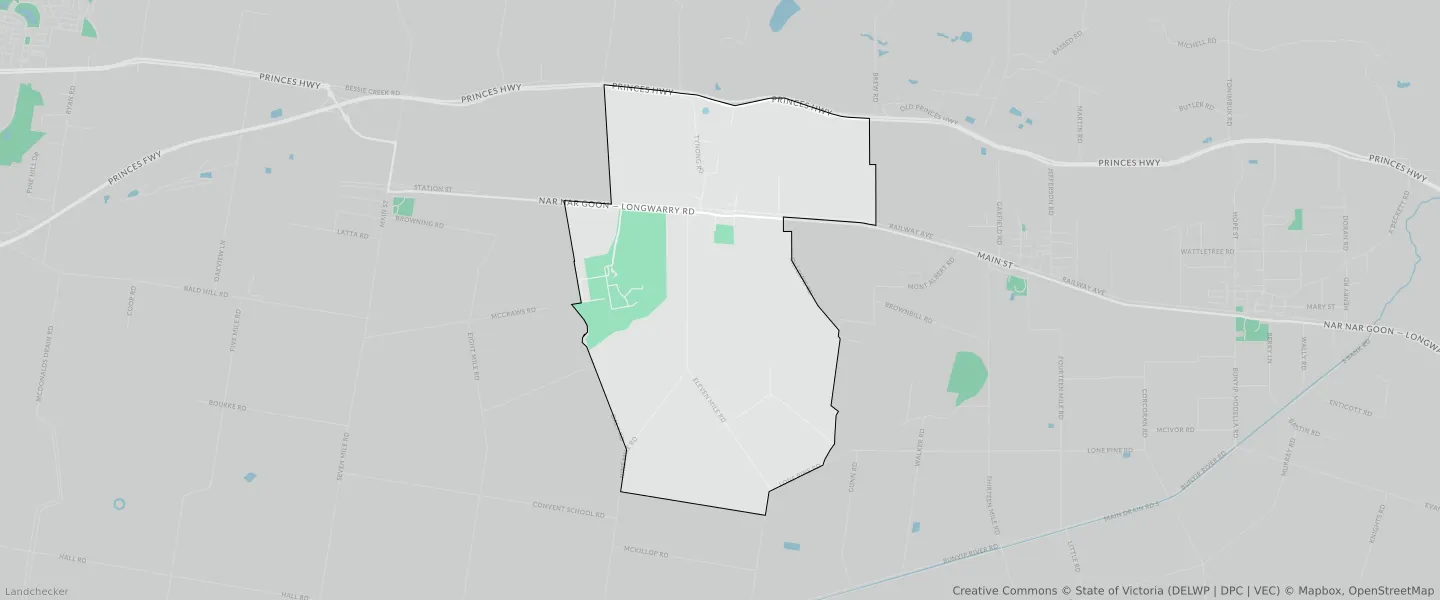
Tynong VIC 3813
This Tynong suburb profile includes demographic data and planning information to help you make an informed property decision.
An average home in Tynong is owned with a mortgage by couples with children. The average age in Tynong is 41. Separate houses are common in Tynong and the area is mostly GREEN WEDGE ZONE (56.31%), SPECIAL USE ZONE (38.14%) and TRANSPORT ZONE (1.58%).
Tynong demographics
Population
523
Average Age
41
Age Distribution
Employment Type
Median Weekly Income
Traveled to Work
Car
86.8%
Tram
0.0%
Bicycle
0.0%
Train
1.7%
Walking
1.7%
Bus
0.0%
Tynong property information
Number of Bedrooms
Tenure Type
Property Types in Tynong
Separate house
Semi detached house
Unit/Apartment
Median monthly mortgage repayments
$1,718
Median weekly rental payments
$311
Average number of bedrooms per dwelling
3.4
Average number of people per household
3
Household Composition
Family Composition
Couple family without children
One parent family
Couple family with children
TYNONG planning zones
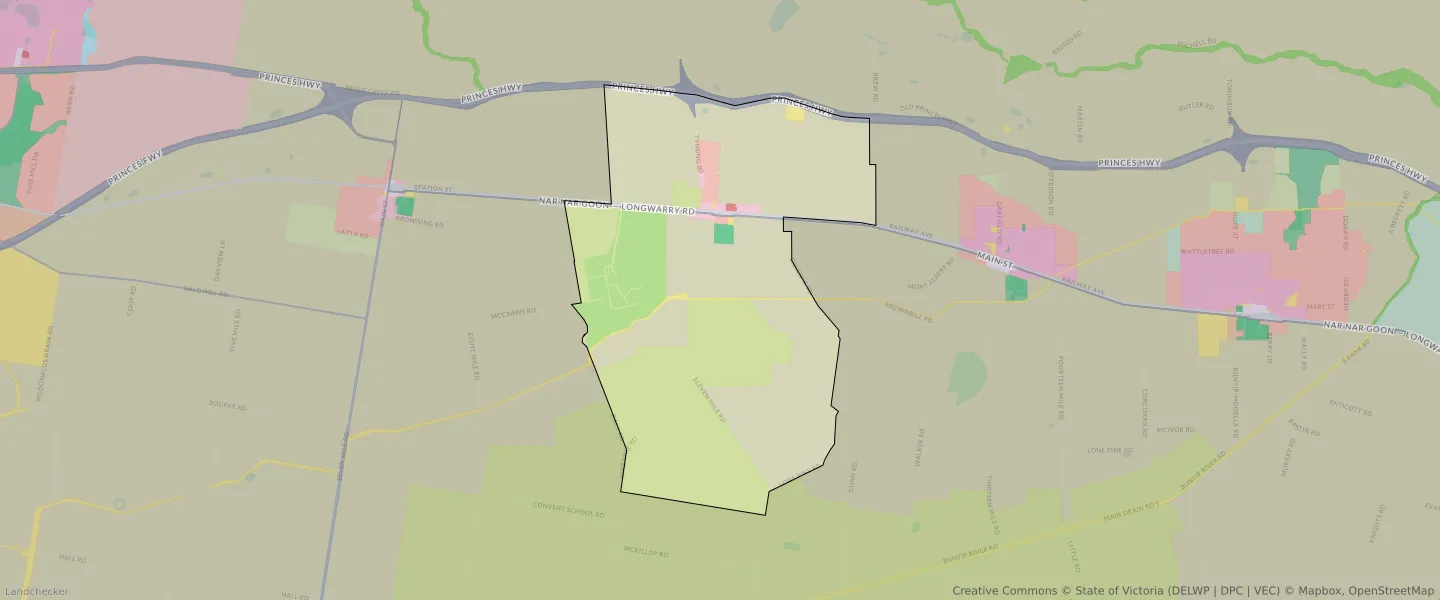
| Zone Code | Zone Name | Percentage Covered | Area Covered | |
|---|---|---|---|---|
| GWZ | GREEN WEDGE ZONE | 56.31% | 12,047,094.61㎡ | |
| LDRZ | LOW DENSITY RESIDENTIAL ZONE | 1.24% | 265,680.66㎡ | |
| MUZ | MIXED USE ZONE | 0.08% | 16,160.44㎡ | |
| NRZ | NEIGHBOURHOOD RESIDENTIAL ZONE | 0.67% | 142,624.13㎡ | |
| PPRZ | PUBLIC PARK AND RECREATION ZONE | 0.39% | 82,991.52㎡ | |
| PUZ | PUBLIC USE ZONE | 0.88% | 188,530.97㎡ | |
| SUZ | SPECIAL USE ZONE | 38.14% | 8,158,637.18㎡ | |
| TRZ1 | TRANSPORT ZONE | 0.72% | 154,302.75㎡ | |
| TRZ2 | TRANSPORT ZONE | 1.58% | 337,854.71㎡ |
Looking to research a property in TYNONG?
Go to mapData Source - ABS