Tivoli QLD 4305
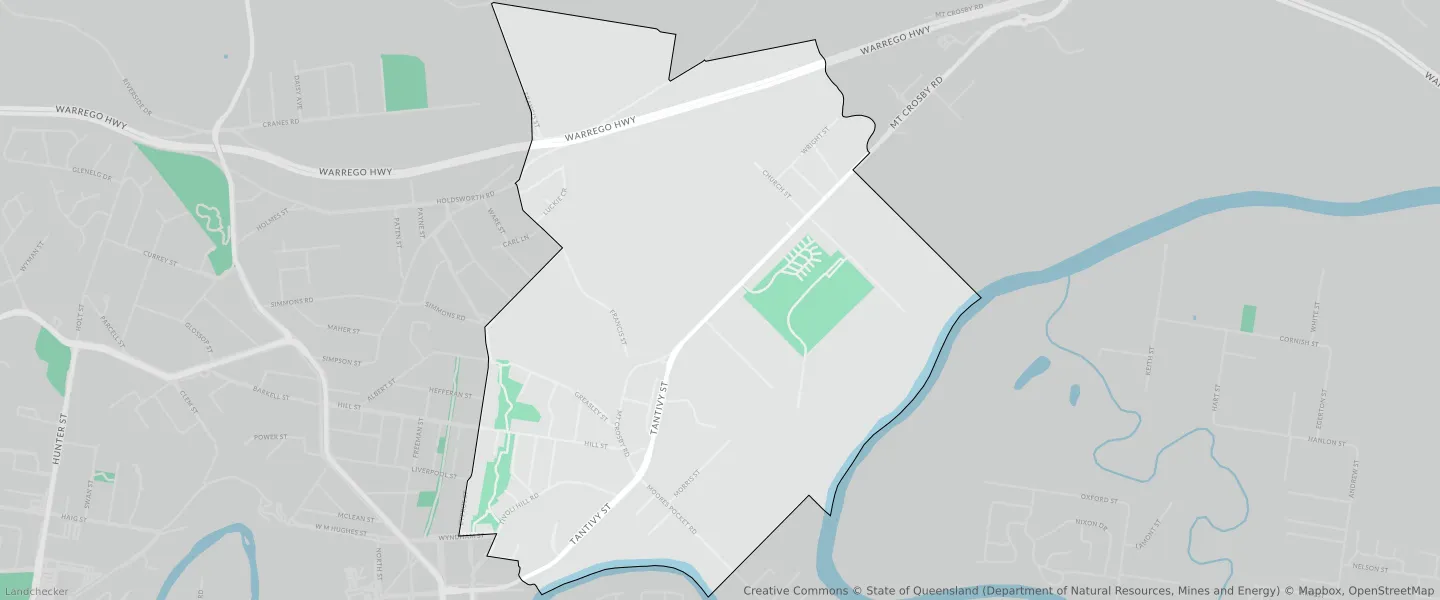
This Tivoli suburb profile includes demographic data and planning information to help you make an informed property decision.
An average home in Tivoli is owned with a mortgage by couples without children. The average age in Tivoli is 40. Separate houses are common in Tivoli and the area is mostly ENVIRONMENTAL MANAGEMENT (39.02%), LOW DENSITY RESIDENTIAL (18.52%) and LOW DENSITY RESIDENTIAL (10.38%).
Tivoli demographics
Population
1460
Average Age
40
Age Distribution
Employment Type
Median Weekly Income
Traveled to Work
Car
86.8%
Tram
0.0%
Bicycle
0.0%
Train
1.6%
Walking
1.2%
Bus
0.0%
Tivoli property information
Number of Bedrooms
Tenure Type
Property Types in Tivoli
Separate house
Semi detached house
Unit/Apartment
Median monthly mortgage repayments
$1,300
Median weekly rental payments
$285
Average number of bedrooms per dwelling
3.1
Average number of people per household
2
Household Composition
Family Composition
Couple family without children
One parent family
Couple family with children
TIVOLI planning zones
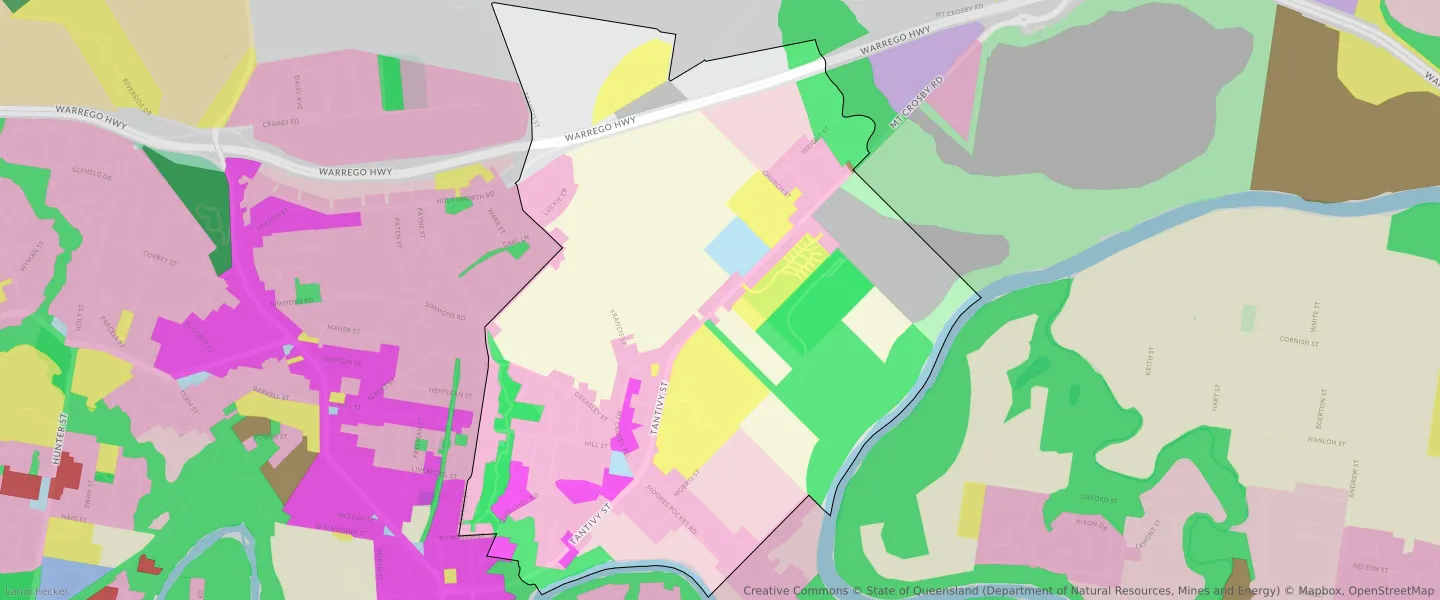
| Zone Code | Zone Name | Percentage Covered | Area Covered | |
|---|---|---|---|---|
| CF | COMMUNITY FACILITIES | 1.51% | 54,066.96㎡ | |
| CR | CHARACTER RESIDENTIAL | 3.44% | 122,777.25㎡ | |
| EM | ENVIRONMENTAL MANAGEMENT | 39.02% | 1,394,012.35㎡ | |
| ES | LOW DENSITY RESIDENTIAL | 18.52% | 661,541.02㎡ | |
| II | INDUSTRY INVESTIGATION | 4.49% | 160,430.79㎡ | |
| LD | LIMITED DEVELOPMENT | 1.13% | 40,384.19㎡ | |
| LIND | LOW IMPACT INDUSTRY | 2.16% | 77,230.3㎡ | |
| LL | LOW DENSITY RESIDENTIAL | 10.38% | 370,999.67㎡ | |
| NC | NEIGHBOURHOOD CENTRE | 0.04% | 1,526.75㎡ | |
| REC | Recreation | 9.3% | 332,308.99㎡ | |
| SLL | LOW DENSITY RESIDENTIAL | 4.73% | 169,131.56㎡ | |
| SP4 | SPECIAL PURPOSE | 1.67% | 59,731.13㎡ |
Looking to research a property in TIVOLI?
Go to mapData Source - ABS