Teralba NSW 2284
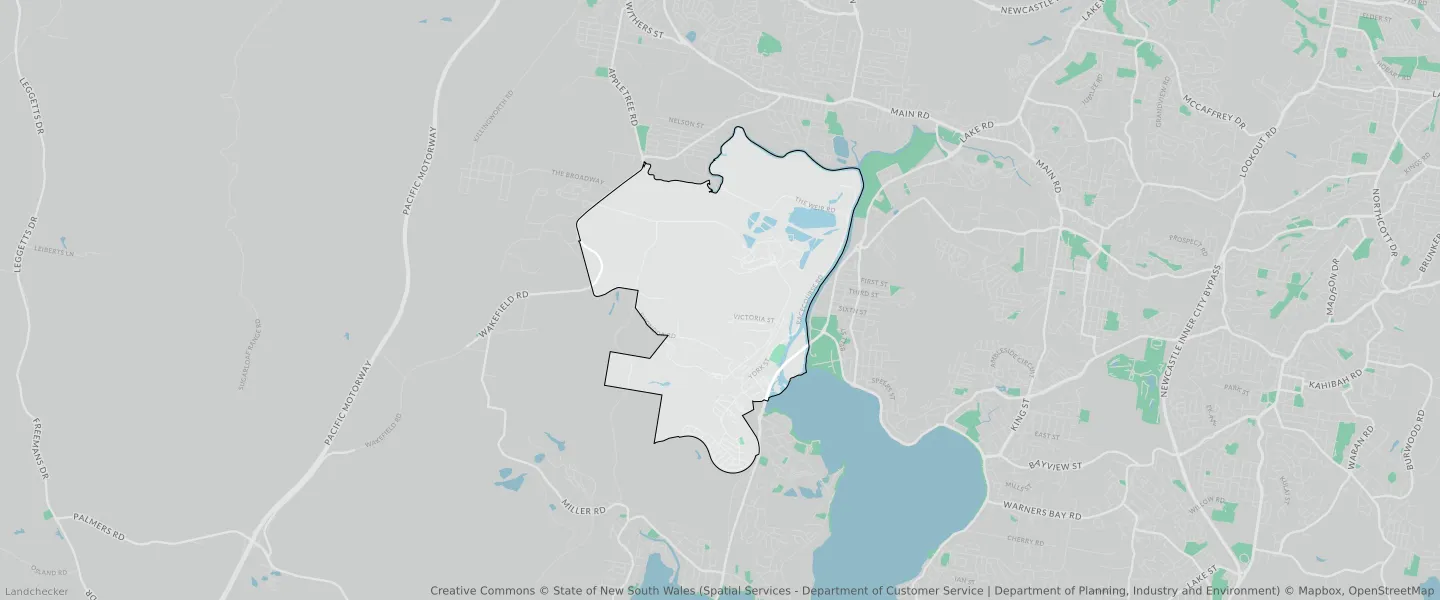
This Teralba suburb profile includes demographic data and planning information to help you make an informed property decision.
An average home in Teralba is owned with a mortgage by couples with children. The average age in Teralba is 37. Separate houses are common in Teralba and the area is mostly Environmental Conservation (52.18%), Infrastructure (18.72%) and Environmental Living (8.41%).
Teralba demographics
Population
2654
Average Age
37
Age Distribution
Employment Type
Median Weekly Income
Traveled to Work
Car
90.1%
Tram
0.0%
Bicycle
0.0%
Train
0.7%
Walking
0.6%
Bus
0.7%
Teralba property information
Number of Bedrooms
Tenure Type
Property Types in Teralba
Separate house
Semi detached house
Unit/Apartment
Median monthly mortgage repayments
$2,167
Median weekly rental payments
$363
Average number of bedrooms per dwelling
3.3
Average number of people per household
3
Household Composition
Family Composition
Couple family without children
One parent family
Couple family with children
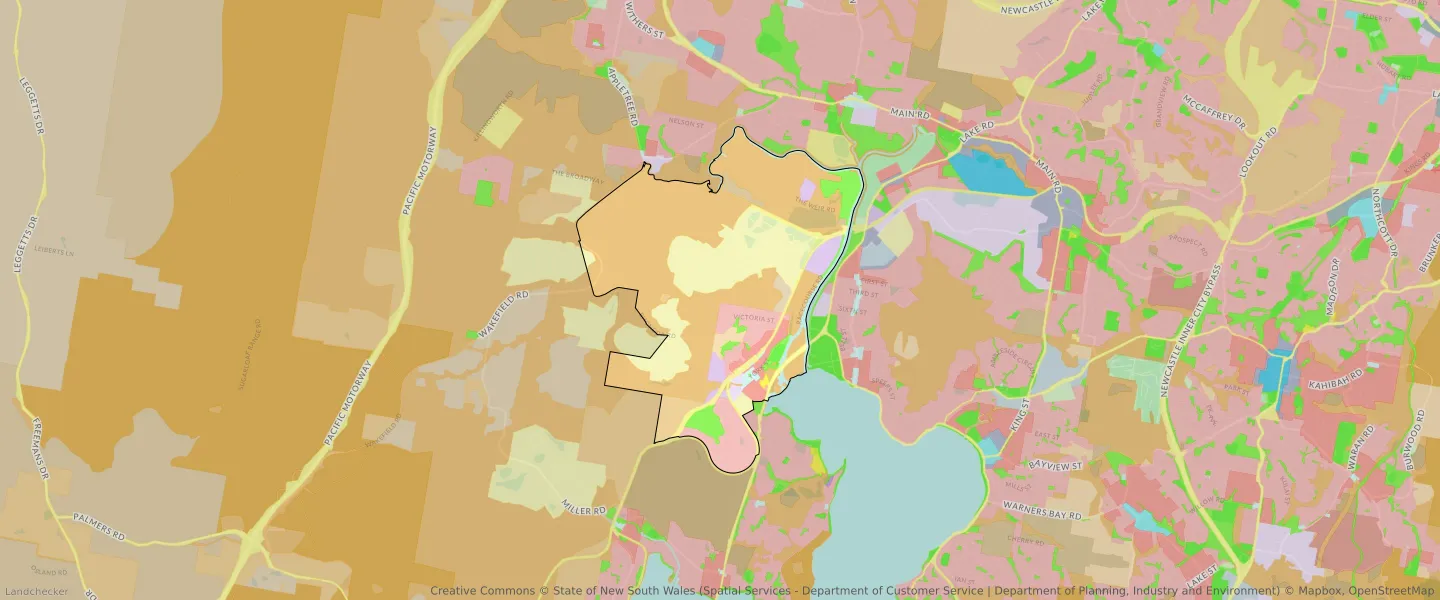
TERALBA planning zones
| Zone Code | Zone Name | Percentage Covered | Area Covered | |
|---|---|---|---|---|
| C2 | Environmental Conservation | 52.18% | 7,411,333.06㎡ | |
| C3 | Environmental Conservation | 2.21% | 314,430.31㎡ | |
| C4 | Environmental Living | 0.86% | 122,757.98㎡ | |
| E1 | Local Centre | 0.42% | 58,977.37㎡ | |
| E4 | General Industrial | 0.52% | 74,437.39㎡ | |
| E5 | Heavy Industrial | 2.78% | 395,156.37㎡ | |
| R2 | Environmental Living | 8.41% | 1,194,035.75㎡ | |
| R3 | Medium Density Residential | 2.29% | 324,615.61㎡ | |
| RE1 | Low Density Residential | 4.45% | 632,003.11㎡ | |
| RU2 | Rural Landscape | 0.68% | 96,211.67㎡ | |
| RU4 | Primary Production Small Lots | 0.91% | 129,010.86㎡ | |
| SP1 | Infrastructure | 18.72% | 2,658,737.46㎡ | |
| SP2 | Infrastructure | 3.33% | 472,718.86㎡ | |
| SP3 | Tourist | 0.13% | 18,455.7㎡ | |
| W1 | Environmental Living | 2.1% | 298,814.03㎡ |
Looking to research a property in TERALBA?
Go to mapData Source - ABS