Telarah NSW 2320
This Telarah suburb profile includes demographic data and planning information to help you make an informed property decision.
An average home in Telarah is owned with a mortgage by couples without children. The average age in Telarah is 36. Separate houses are common in Telarah and the area is mostly General Residential (43.59%), Primary Production (15.41%) and Infrastructure (12.23%).
Telarah demographics
Population
2318
Average Age
36
Age Distribution
Employment Type
Median Weekly Income
Traveled to Work
Car
86.9%
Tram
0.0%
Bicycle
0.0%
Train
1.1%
Walking
3.3%
Bus
1.1%
Telarah property information
Number of Bedrooms
Tenure Type
Property Types in Telarah
Separate house
Semi detached house
Unit/Apartment
Median monthly mortgage repayments
$1,500
Median weekly rental payments
$300
Average number of bedrooms per dwelling
2.9
Average number of people per household
2
Household Composition
Family Composition
Couple family without children
One parent family
Couple family with children
TELARAH planning zones
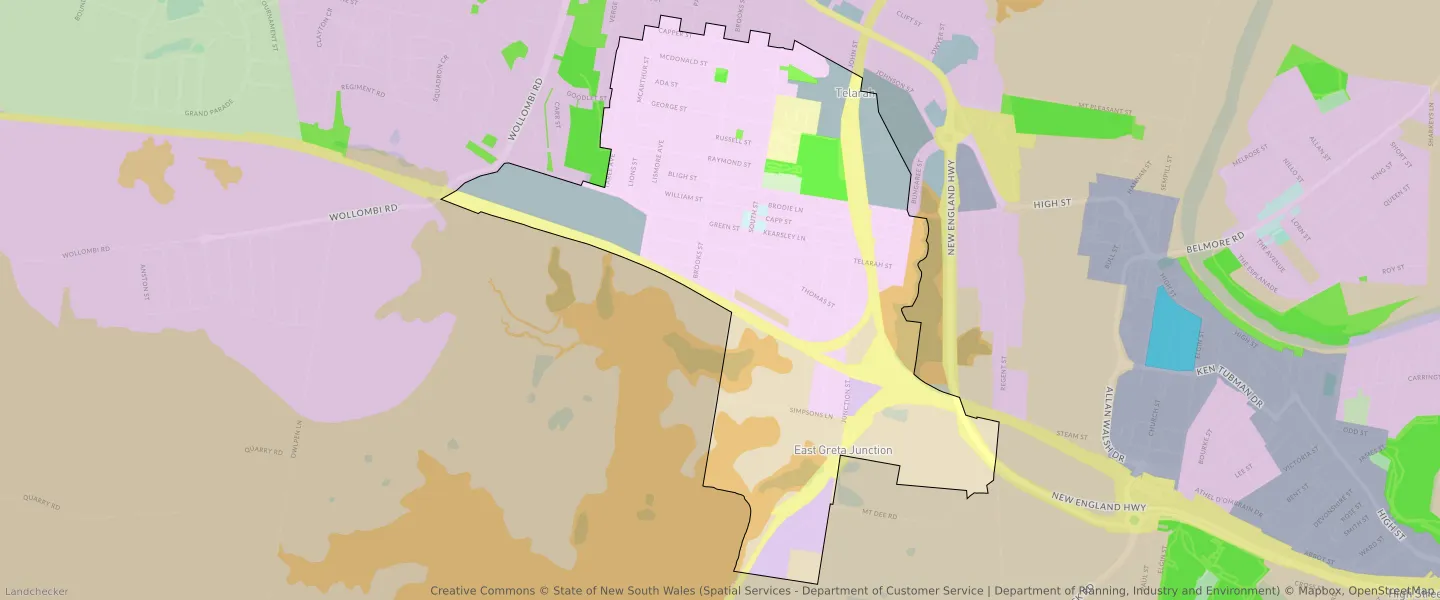
| Zone Code | Zone Name | Percentage Covered | Area Covered | |
|---|---|---|---|---|
| C2 | Environmental Conservation | 9.38% | 197,127.29㎡ | |
| E1 | Local Centre | 0.29% | 6,051.8㎡ | |
| E3 | Business Development | 10.35% | 217,648.31㎡ | |
| E4 | General Industrial | 3.17% | 66,599.89㎡ | |
| R1 | General Residential | 43.59% | 916,482.78㎡ | |
| RE1 | Low Density Residential | 2.83% | 59,430.11㎡ | |
| RE2 | Private Recreation | 0.48% | 10,186.64㎡ | |
| RU1 | Primary Production | 15.41% | 323,971.81㎡ | |
| RU2 | Rural Landscape | 0.37% | 7,855.84㎡ | |
| SP1 | Infrastructure | 1.89% | 39,711.64㎡ | |
| SP2 | Infrastructure | 12.23% | 257,142.04㎡ |
Looking to research a property in TELARAH?
Go to mapData Source - ABS