Taroomball QLD 4703

This Taroomball suburb profile includes demographic data and planning information to help you make an informed property decision.
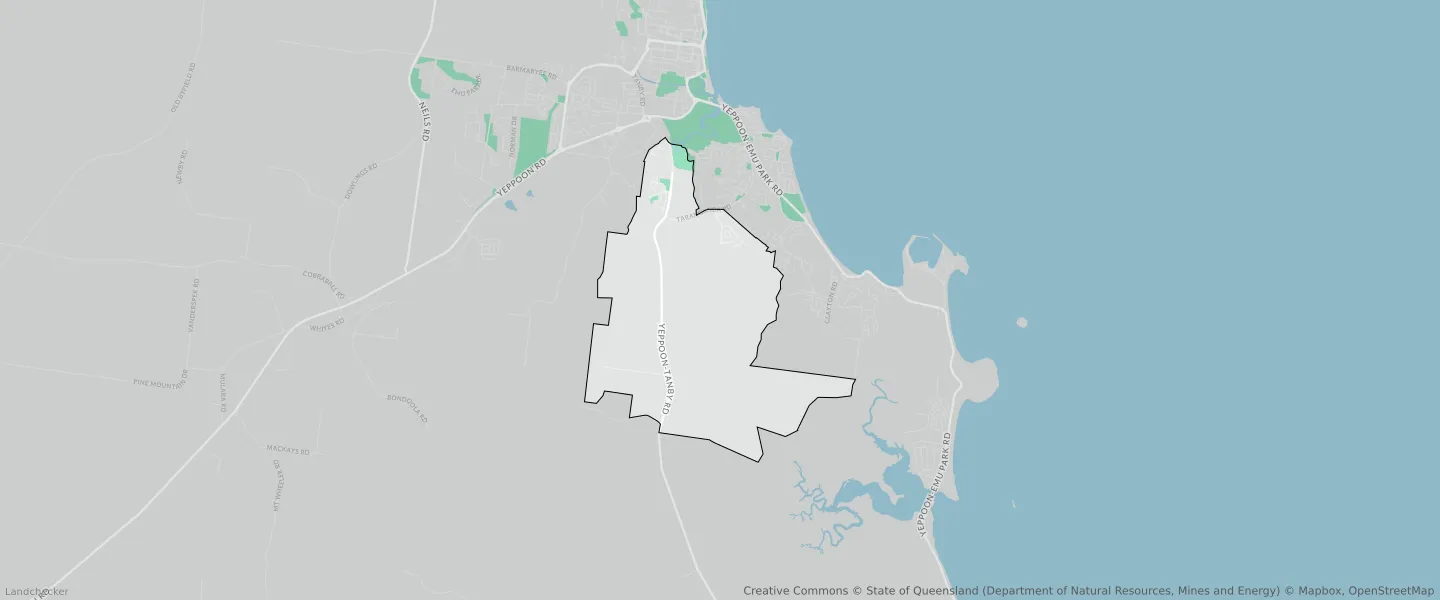
An average home in Taroomball is owned with a mortgage by couples with children. The average age in Taroomball is 35. Separate houses are common in Taroomball and the area is mostly L1 - Rural (53.44%), L1 - Emerging communities (34.73%) and L2 - Low density residential (3.68%).
Taroomball demographics
Population
1136
Average Age
35
Age Distribution
Employment Type
Median Weekly Income
Traveled to Work
Car
87.3%
Tram
0.0%
Bicycle
0.8%
Train
0.0%
Walking
0.8%
Bus
0.8%
Taroomball property information
Number of Bedrooms
Tenure Type
Property Types in Taroomball
Separate house
Semi detached house
Unit/Apartment
Median monthly mortgage repayments
$1,950
Median weekly rental payments
$460
Average number of bedrooms per dwelling
3.8
Average number of people per household
3
Household Composition
Family Composition
Couple family without children
One parent family
Couple family with children
TAROOMBALL planning zones
| Zone Code | Zone Name | Percentage Covered | Area Covered | |
|---|---|---|---|---|
| COMMUNITY FACILITIES | L1 - Community Facilities | 0.03% | 4,119.84㎡ | |
| EMERGING COMMUNITIES | L1 - Emerging communities | 34.73% | 4,550,744.9㎡ | |
| ENVIRONMENTAL MANAGEMENT AND CONSERVATION | L1 - Environmental management and conservation | 1.6% | 210,211.05㎡ | |
| LOW DENSITY RESIDENTIAL | L2 - Low density residential | 3.68% | 481,719.42㎡ | |
| LOW MEDIUM DENSITY RESIDENTIAL | L2 - Low medium density residential | 1.82% | 238,781.91㎡ | |
| OPEN SPACE | L2 - Open space | 0.34% | 44,900.79㎡ | |
| RURAL | L1 - Rural | 53.44% | 7,001,648.99㎡ | |
| SPECIAL PURPOSE | L1 - Special purpose | 0% | 574.38㎡ |
Looking to research a property in TAROOMBALL?
Go to mapData Source - ABS