Tallong NSW 2579
This Tallong suburb profile includes demographic data and planning information to help you make an informed property decision.
An average home in Tallong is owned with a mortgage by couples without children. The average age in Tallong is 48. Separate houses are common in Tallong and the area is mostly Rural Landscape (39.32%), National Parks and Nature Reserves (34.96%) and Environmental Conservation (16.96%).
Tallong demographics
Population
914
Average Age
48
Age Distribution
Employment Type
Median Weekly Income
Traveled to Work
Car
88.1%
Tram
0.0%
Bicycle
0.0%
Train
0.0%
Walking
3.1%
Bus
0.0%
Tallong property information
Number of Bedrooms
Tenure Type
Property Types in Tallong
Separate house
Semi detached house
Unit/Apartment
Median monthly mortgage repayments
$2,015
Median weekly rental payments
$385
Average number of bedrooms per dwelling
3.5
Average number of people per household
3
Household Composition
Family Composition
Couple family without children
One parent family
Couple family with children
TALLONG planning zones
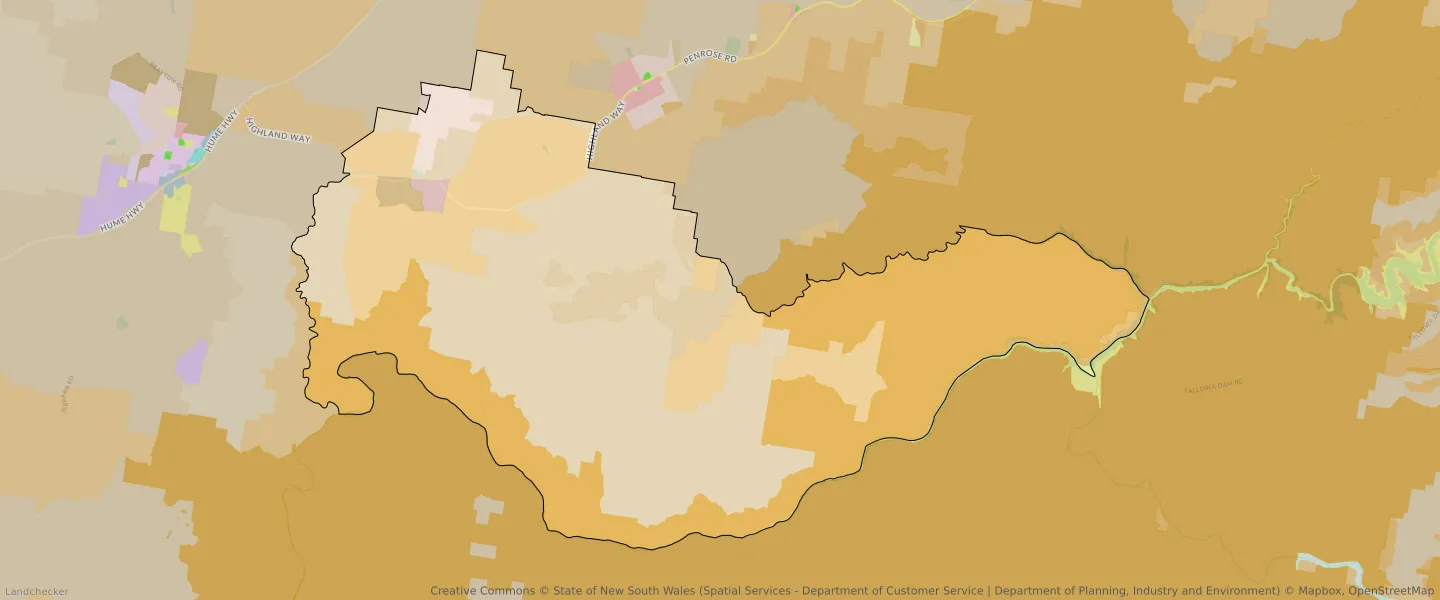
| Zone Code | Zone Name | Percentage Covered | Area Covered | |
|---|---|---|---|---|
| C1 | National Parks and Nature Reserves | 0.03% | 63,687.96㎡ | |
| C1 | National Parks and Nature Reserves | 34.96% | 69,300,211.94㎡ | |
| C1 | National Parks and Nature Reserves | 0% | 9,543.15㎡ | |
| C2 | Environmental Conservation | 1.12% | 2,213,134.8㎡ | |
| C3 | Environmental Conservation | 0.39% | 778,260.46㎡ | |
| C3 | Environmental Conservation | 16.96% | 33,631,675.24㎡ | |
| R5 | Large Lot Residential | 1.81% | 3,595,910.75㎡ | |
| RU2 | Rural Landscape | 39.32% | 77,963,502.07㎡ | |
| RU3 | Forestry | 2.82% | 5,596,375.59㎡ | |
| RU3 | Forestry | 1.54% | 3,055,039.52㎡ | |
| RU5 | Village | 0.43% | 848,471.67㎡ | |
| RU6 | Transition | 0.58% | 1,141,051.13㎡ | |
| SP2 | Infrastructure | 0.08% | 151,350.86㎡ |
Looking to research a property in TALLONG?
Go to mapData Source - ABS