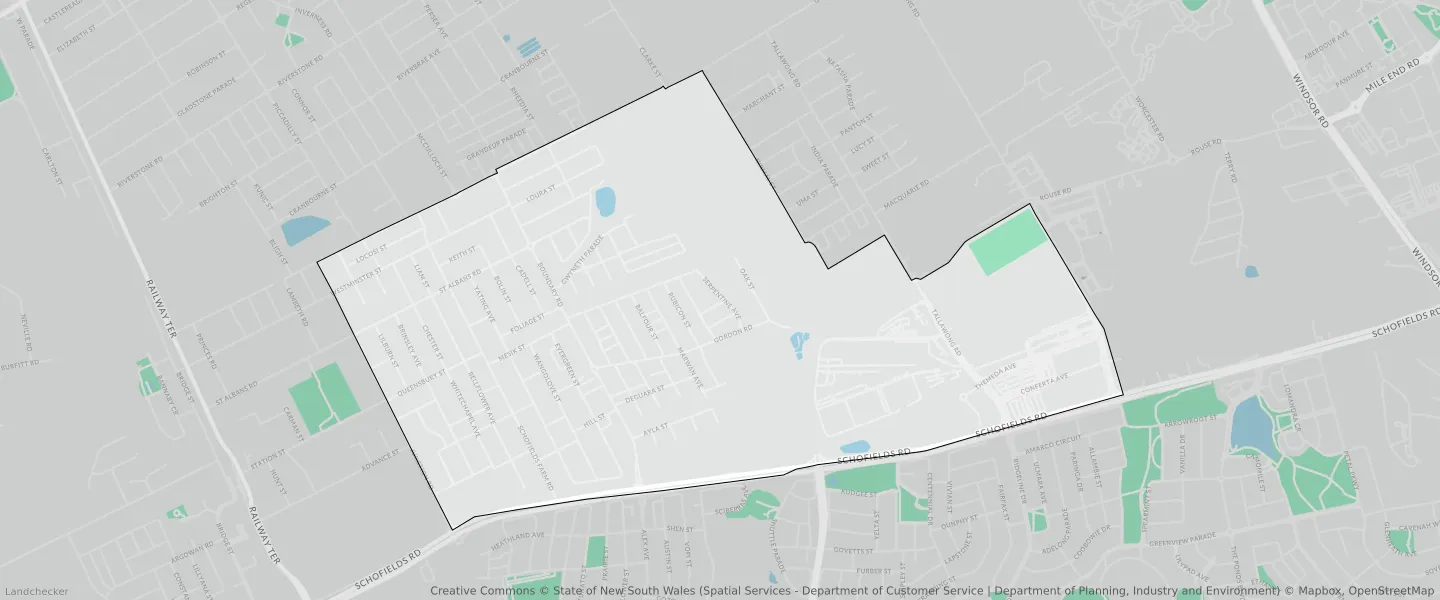
Tallawong NSW 2762
This Tallawong suburb profile includes demographic data and planning information to help you make an informed property decision.
An average home in Tallawong is owned with a mortgage by couples with children. The average age in Tallawong is 30. Separate houses are common in Tallawong and the area is mostly Environmental Living (45.34%), Medium Density Residential (16.64%) and Infrastructure (11.6%).
Tallawong demographics
Population
6570
Average Age
30
Age Distribution
Employment Type
Median Weekly Income
Traveled to Work
Car
82.2%
Tram
0.0%
Bicycle
0.0%
Train
8.4%
Walking
0.2%
Bus
0.6%
Tallawong property information
Number of Bedrooms
Tenure Type
Property Types in Tallawong
Separate house
Semi detached house
Unit/Apartment
Median monthly mortgage repayments
$3,000
Median weekly rental payments
$575
Average number of bedrooms per dwelling
3.9
Average number of people per household
3
Household Composition
Family Composition
Couple family without children
One parent family
Couple family with children
TALLAWONG planning zones
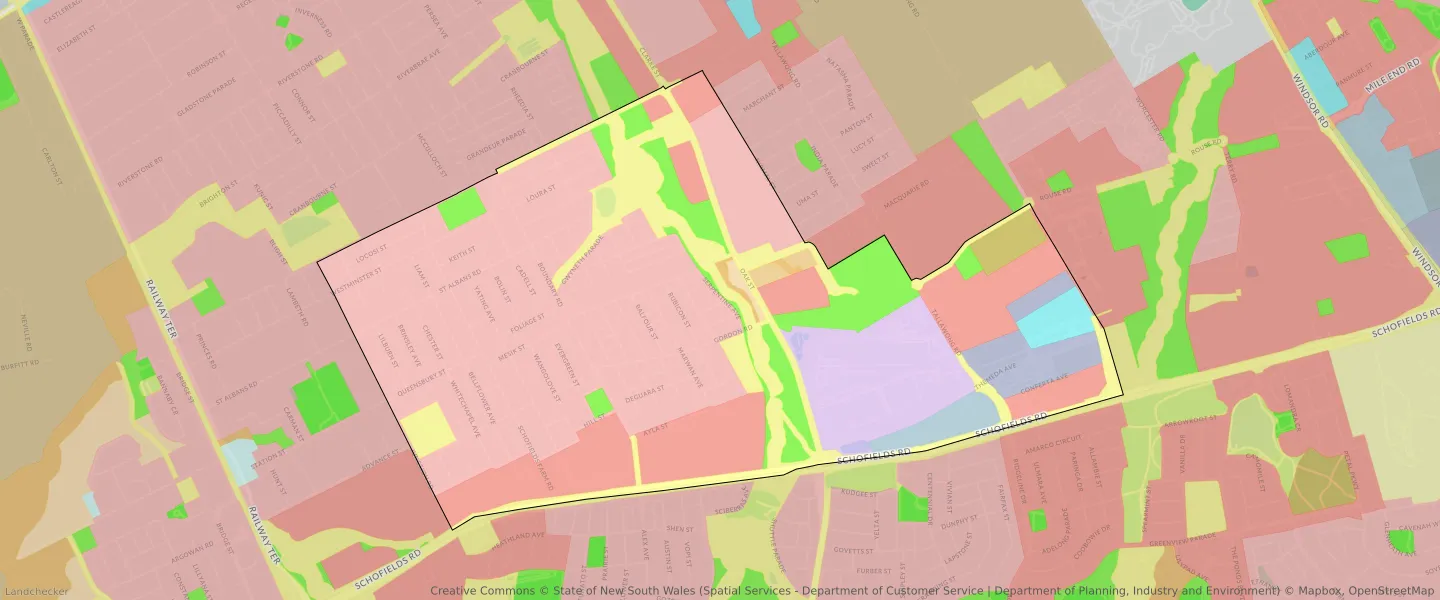
| Zone Code | Zone Name | Percentage Covered | Area Covered | |
|---|---|---|---|---|
| B2 | Local Centre | 1.35% | 43,648.94㎡ | |
| B4 | Mixed Use | 3.37% | 108,819.15㎡ | |
| B6 | Enterprise Corridor | 1.69% | 54,750.01㎡ | |
| C2 | Environmental Conservation | 1.54% | 49,868.06㎡ | |
| C3 | Environmental Conservation | 0.52% | 16,843.51㎡ | |
| C4 | Environmental Living | 0.26% | 8,555.53㎡ | |
| IN1 | General Industrial | 8.64% | 279,282.69㎡ | |
| R2 | Environmental Living | 45.34% | 1,465,306.82㎡ | |
| R3 | Medium Density Residential | 16.64% | 537,875.41㎡ | |
| RE1 | Low Density Residential | 7.67% | 247,901.18㎡ | |
| SP2 | Infrastructure | 1.36% | 43,983.61㎡ | |
| SP2 | Infrastructure | 11.6% | 374,932.13㎡ |
Looking to research a property in TALLAWONG?
Go to mapData Source - ABS