St Morris SA 5068
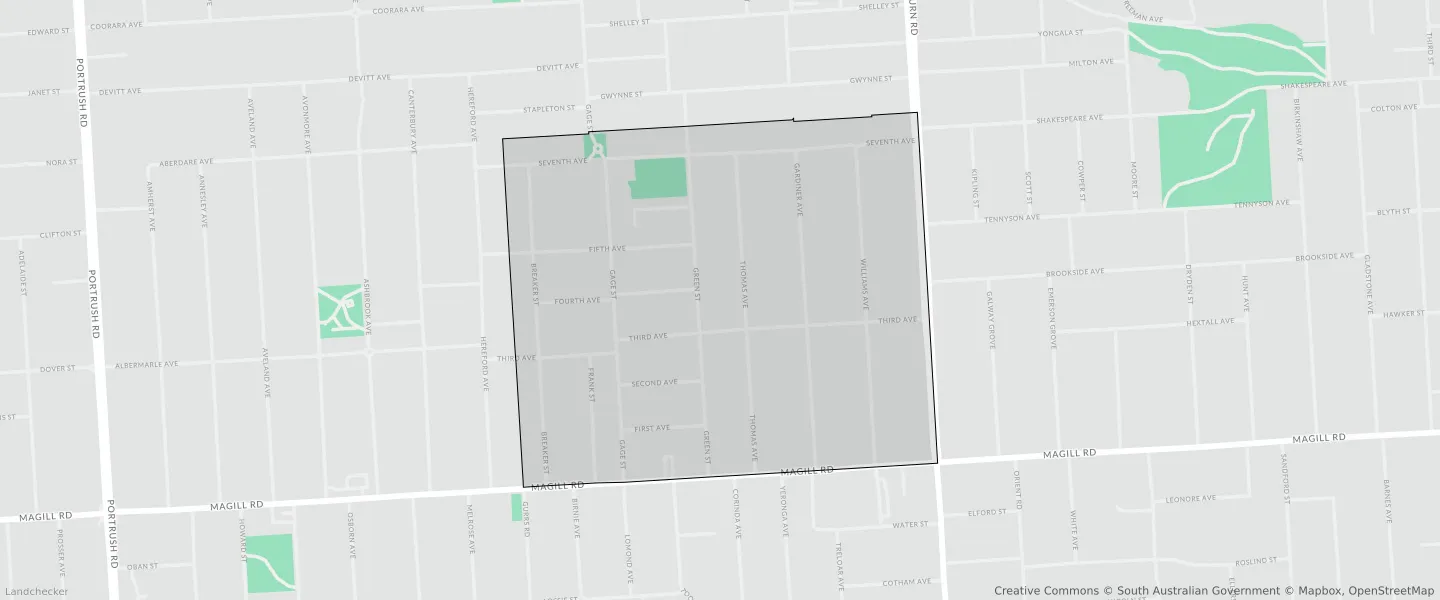
This St Morris suburb profile includes demographic data and planning information to help you make an informed property decision.
An average home in St Morris is owned outright by couples with children. The average age in St Morris is 40. Separate houses are common in St Morris and the area is mostly ESTABLISHED NEIGHBOURHOOD (84.08%), SUBURBAN MAIN STREET (8.51%) and GENERAL NEIGHBOURHOOD (6.41%).
St Morris demographics
Population
1598
Average Age
40
Age Distribution
Employment Type
Median Weekly Income
Traveled to Work
Car
80.4%
Tram
0.0%
Bicycle
2.2%
Train
0.0%
Walking
1.2%
Bus
7.0%
St Morris property information
Number of Bedrooms
Tenure Type
Property Types in St Morris
Separate house
Semi detached house
Unit/Apartment
Median monthly mortgage repayments
$1,895
Median weekly rental payments
$343
Average number of bedrooms per dwelling
2.8
Average number of people per household
2
Household Composition
Family Composition
Couple family without children
One parent family
Couple family with children
ST MORRIS planning zones
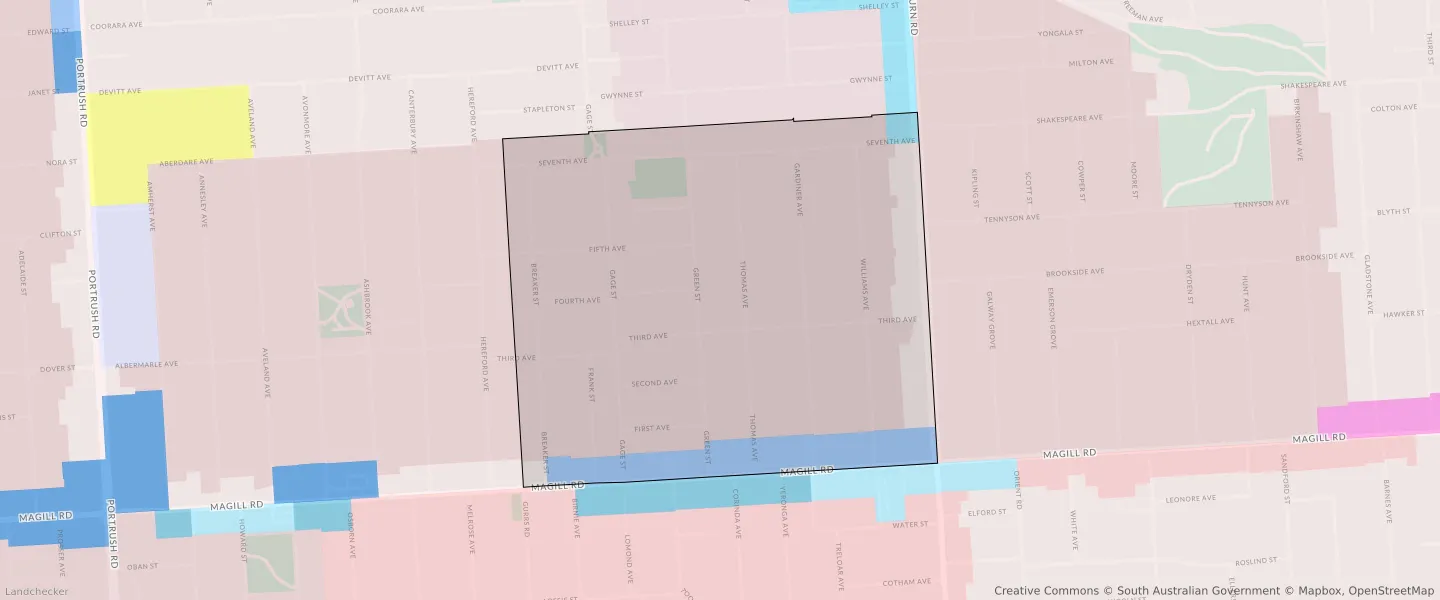
| Zone Code | Zone Name | Percentage Covered | Area Covered | |
|---|---|---|---|---|
| EN | ESTABLISHED NEIGHBOURHOOD | 84.08% | 468,855.99㎡ | |
| GN | GENERAL NEIGHBOURHOOD | 6.41% | 35,750.56㎡ | |
| HDN | HOUSING DIVERSITY NEIGHBOURHOOD | 0.34% | 1,882.33㎡ | |
| SAC | SUBURBAN ACTIVITY CENTRE | 0.66% | 3,674.98㎡ | |
| SMS | SUBURBAN MAIN STREET | 8.51% | 47,443.95㎡ |
Looking to research a property in ST MORRIS?
Go to mapData Source - ABS