Pymble NSW 2073
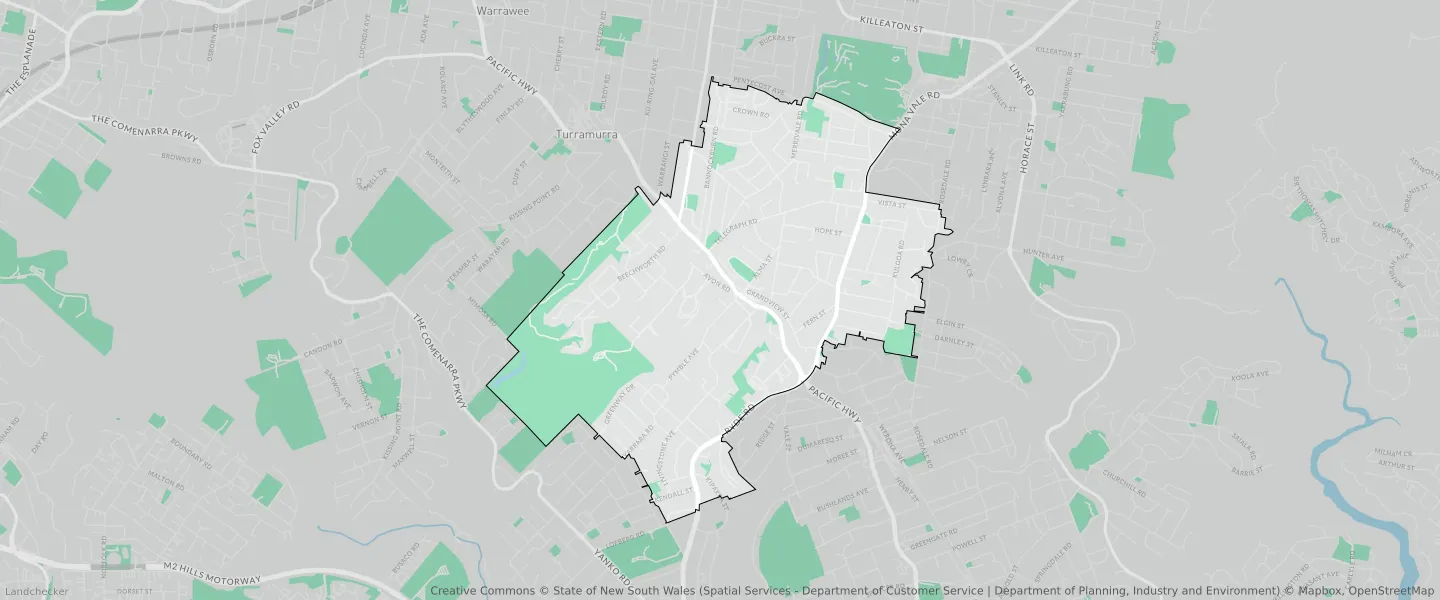
This Pymble suburb profile includes demographic data and planning information to help you make an informed property decision.
An average home in Pymble is owned with a mortgage by couples with children. The average age in Pymble is 41. Separate houses are common in Pymble and the area is mostly Environmental Living (61.2%), Environmental Conservation (8.96%) and Infrastructure (8.63%).
Pymble demographics
Population
11775
Average Age
41
Age Distribution
Employment Type
Median Weekly Income
Traveled to Work
Car
80.7%
Tram
0.0%
Bicycle
0.4%
Train
7.5%
Walking
2.9%
Bus
0.7%
Pymble property information
Number of Bedrooms
Tenure Type
Property Types in Pymble
Separate house
Semi detached house
Unit/Apartment
Median monthly mortgage repayments
$3,689
Median weekly rental payments
$630
Average number of bedrooms per dwelling
3.6
Average number of people per household
3
Household Composition
Family Composition
Couple family without children
One parent family
Couple family with children
PYMBLE planning zones
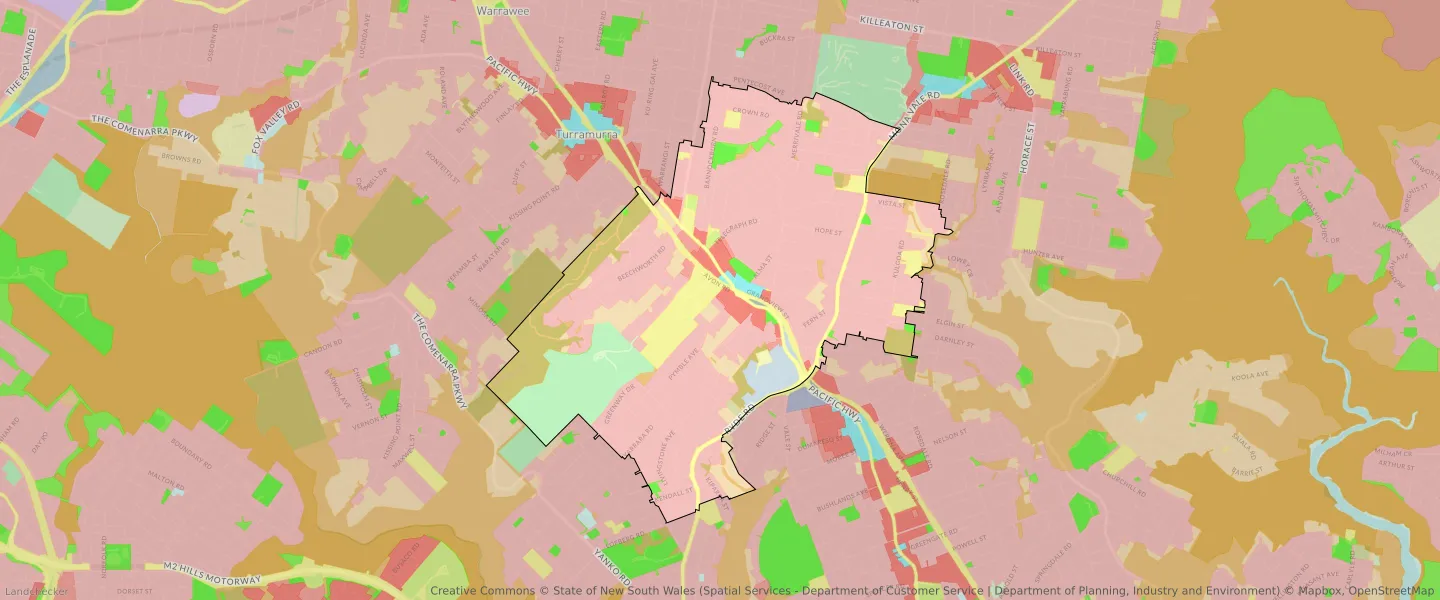
| Zone Code | Zone Name | Percentage Covered | Area Covered | |
|---|---|---|---|---|
| C2 | Environmental Conservation | 8.96% | 584,409.09㎡ | |
| C4 | Environmental Living | 6.12% | 399,271.08㎡ | |
| E1 | Local Centre | 0.5% | 32,338.12㎡ | |
| E3 | Business Development | 1.96% | 127,925.91㎡ | |
| R2 | Environmental Living | 61.2% | 3,992,153.42㎡ | |
| R3 | Medium Density Residential | 0.62% | 40,313.21㎡ | |
| R4 | High Density Residential | 2.19% | 143,179.68㎡ | |
| RE1 | Low Density Residential | 1.84% | 120,127.81㎡ | |
| RE2 | Private Recreation | 7.79% | 508,393.57㎡ | |
| SP1 | Infrastructure | 0.18% | 11,765.43㎡ | |
| SP2 | Infrastructure | 8.63% | 563,239.94㎡ |
Looking to research a property in PYMBLE?
Go to mapData Source - ABS