Pemulwuy NSW 2145
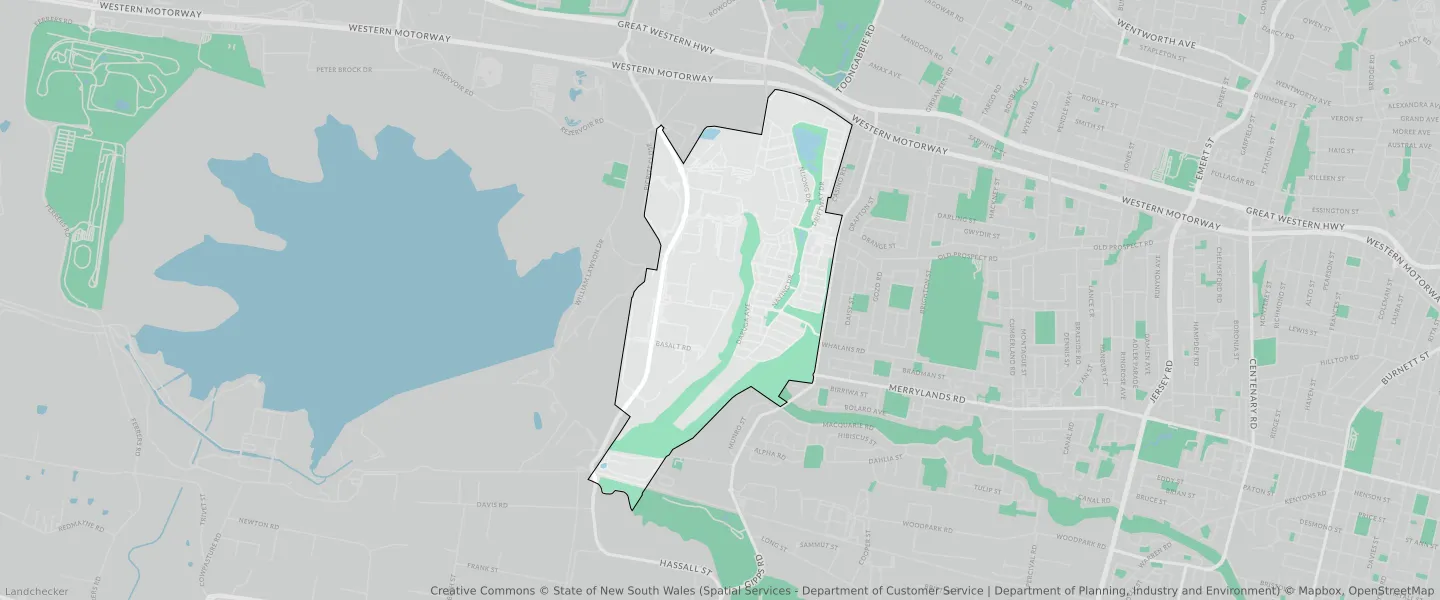
This Pemulwuy suburb profile includes demographic data and planning information to help you make an informed property decision.
An average home in Pemulwuy is owned with a mortgage by couples with children. The average age in Pemulwuy is 37. Separate houses are common in Pemulwuy and the area is mostly Light Industrial (23.93%), General Industrial (22.85%) and Medium Density Residential (21.68%).
Pemulwuy demographics
Population
5532
Average Age
37
Age Distribution
Employment Type
Median Weekly Income
Traveled to Work
Car
85.8%
Tram
0.0%
Bicycle
0.0%
Train
2.1%
Walking
2.1%
Bus
0.9%
Pemulwuy property information
Number of Bedrooms
Tenure Type
Property Types in Pemulwuy
Separate house
Semi detached house
Unit/Apartment
Median monthly mortgage repayments
$2,511
Median weekly rental payments
$570
Average number of bedrooms per dwelling
3.5
Average number of people per household
3
Household Composition
Family Composition
Couple family without children
One parent family
Couple family with children
PEMULWUY planning zones
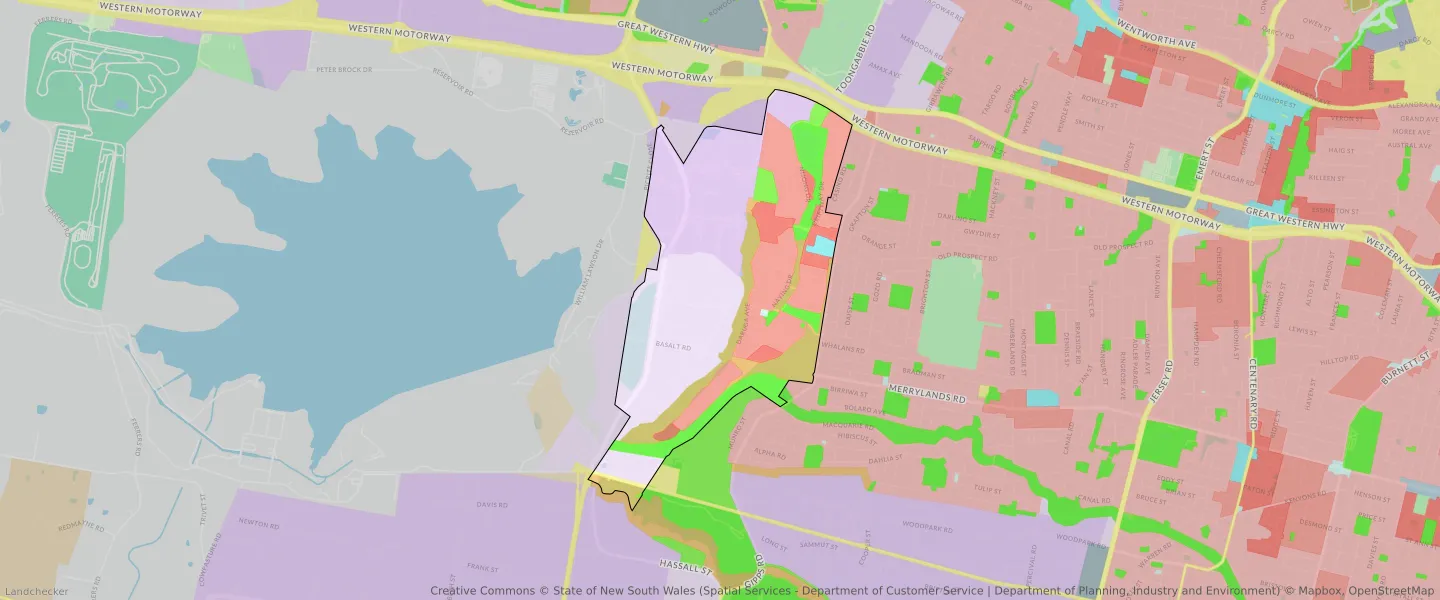
| Zone Code | Zone Name | Percentage Covered | Area Covered | |
|---|---|---|---|---|
| B7 | Business Park | 3.63% | 134,438.93㎡ | |
| C2 | Environmental Conservation | 0.02% | 628.79㎡ | |
| C2 | Environmental Conservation | 11.82% | 437,489.12㎡ | |
| E1 | Local Centre | 0.8% | 29,601.22㎡ | |
| IN1 | General Industrial | 22.85% | 845,808.69㎡ | |
| IN2 | Light Industrial | 23.93% | 885,527.31㎡ | |
| R2 | Environmental Living | 0.02% | 591.54㎡ | |
| R3 | Medium Density Residential | 21.68% | 802,426.63㎡ | |
| R4 | High Density Residential | 4.47% | 165,624.04㎡ | |
| RE1 | Low Density Residential | 10.4% | 384,765.94㎡ | |
| SP2 | Infrastructure | 0.33% | 12,312.59㎡ | |
| SP2 | Infrastructure | 0.01% | 237.03㎡ |
Looking to research a property in PEMULWUY?
Go to mapData Source - ABS