Murrumbateman NSW 2582
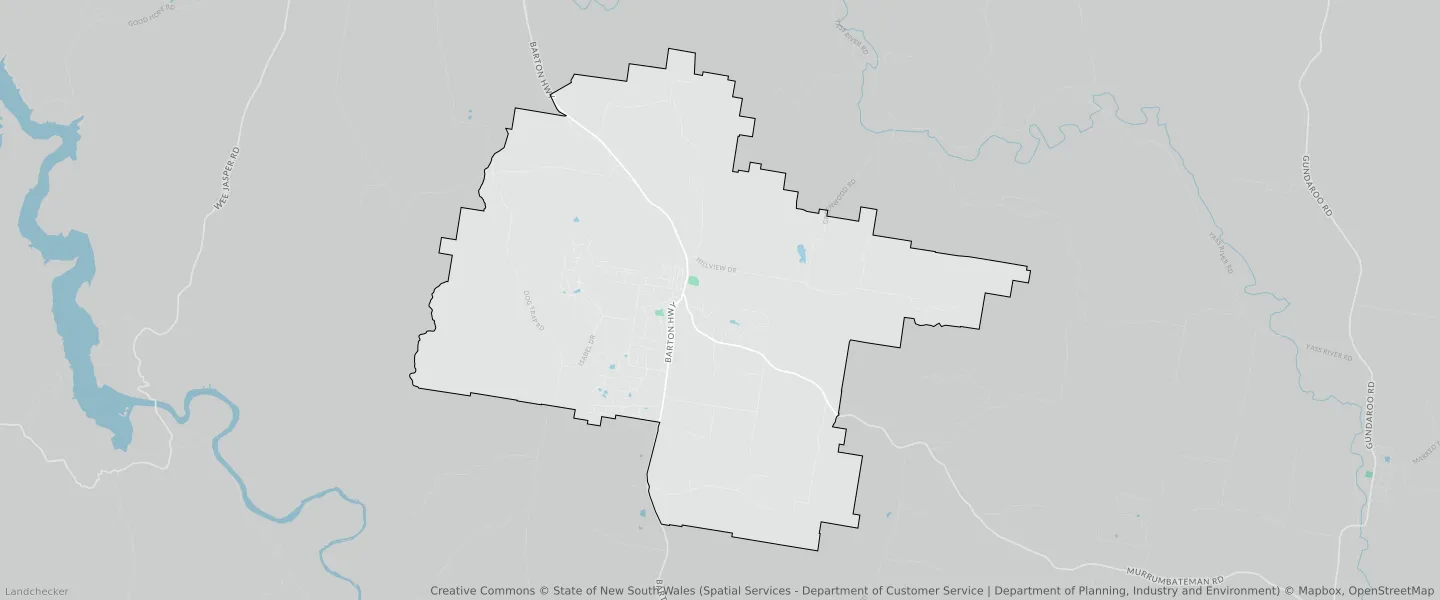
This Murrumbateman suburb profile includes demographic data and planning information to help you make an informed property decision.
An average home in Murrumbateman is owned with a mortgage by couples with children. The average age in Murrumbateman is 40. Separate houses are common in Murrumbateman and the area is mostly Primary Production (72.71%), Large Lot Residential (10.76%) and Primary Production Small Lots (9.43%).
Murrumbateman demographics
Population
3607
Average Age
40
Age Distribution
Employment Type
Median Weekly Income
Traveled to Work
Car
88.5%
Tram
0.0%
Bicycle
0.0%
Train
0.0%
Walking
2.3%
Bus
0.5%
Murrumbateman property information
Number of Bedrooms
Tenure Type
Property Types in Murrumbateman
Separate house
Semi detached house
Unit/Apartment
Median monthly mortgage repayments
$2,600
Median weekly rental payments
$528
Average number of bedrooms per dwelling
3.9
Average number of people per household
3
Household Composition
Family Composition
Couple family without children
One parent family
Couple family with children
MURRUMBATEMAN planning zones
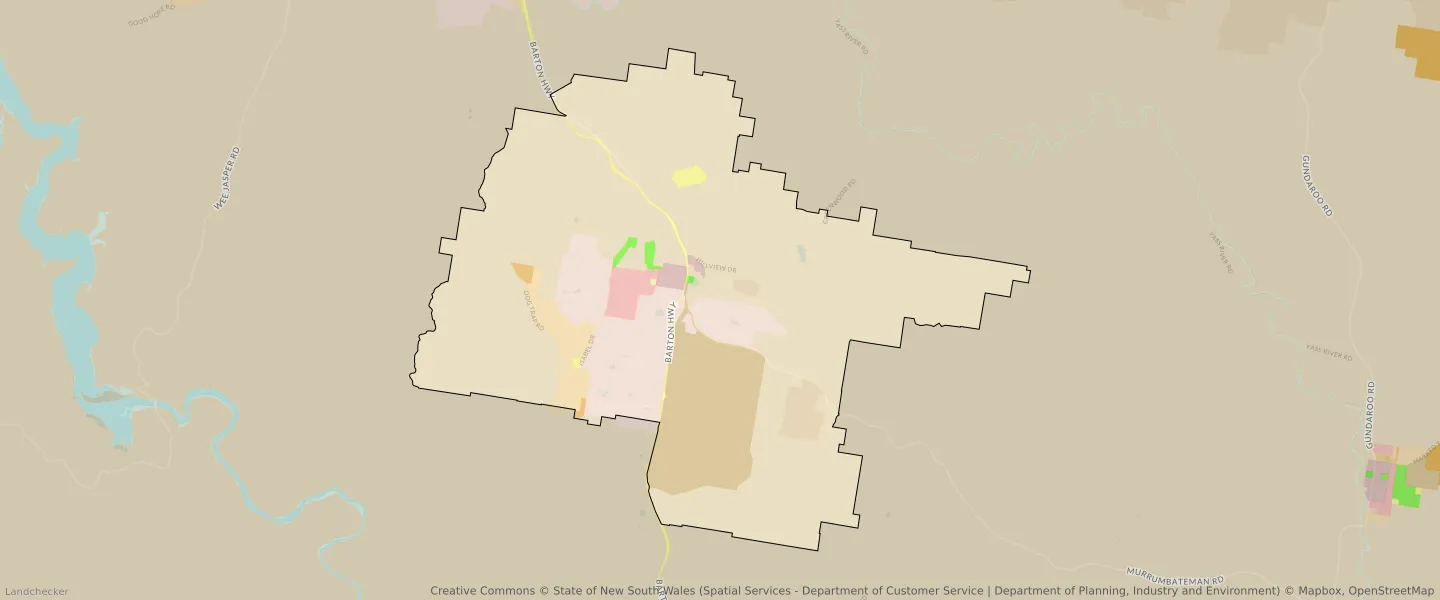
| Zone Code | Zone Name | Percentage Covered | Area Covered | |
|---|---|---|---|---|
| C2 | Environmental Conservation | 0.27% | 401,079.65㎡ | |
| C4 | Environmental Living | 2.43% | 3,644,444.35㎡ | |
| R2 | Environmental Living | 1.2% | 1,791,645.21㎡ | |
| R5 | Large Lot Residential | 10.76% | 16,127,175.9㎡ | |
| RE1 | Low Density Residential | 0.56% | 840,965.79㎡ | |
| RU1 | Primary Production | 72.71% | 108,963,332.13㎡ | |
| RU2 | Rural Landscape | 1.4% | 2,102,499.92㎡ | |
| RU4 | Primary Production Small Lots | 9.43% | 14,124,649.36㎡ | |
| RU5 | Village | 0.54% | 802,726㎡ | |
| SP1 | Infrastructure | 0.02% | 30,741.68㎡ | |
| SP2 | Infrastructure | 0.69% | 1,029,243.85㎡ |
Looking to research a property in MURRUMBATEMAN?
Go to mapData Source - ABS