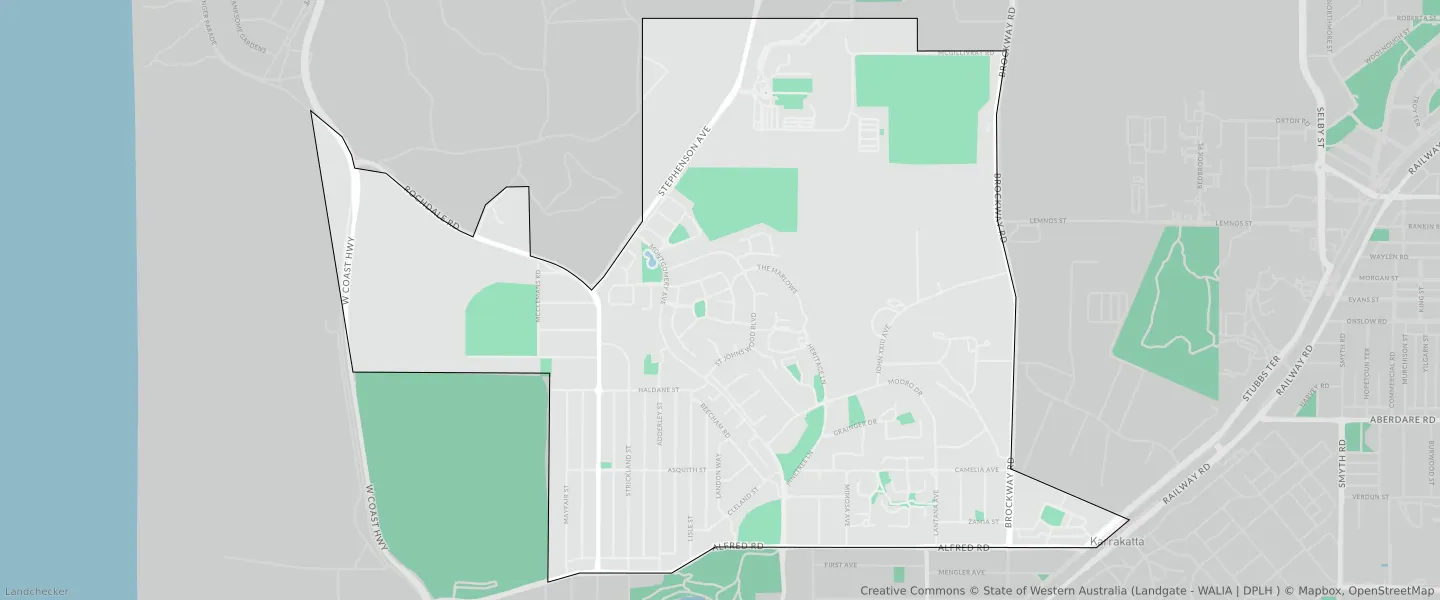
Mount Claremont WA 6010
This Mount Claremont suburb profile includes demographic data and planning information to help you make an informed property decision.
An average home in Mount Claremont is owned outright by couples with children. The average age in Mount Claremont is 45. Separate houses are common in Mount Claremont and the area is mostly URBAN ZONE (71.49%), URBAN (71.49%) and RESIDENTIAL (24.66%).
Mount Claremont demographics
Population
4999
Average Age
45
Age Distribution
Employment Type
Median Weekly Income
Traveled to Work
Car
78.1%
Tram
0.0%
Bicycle
2.8%
Train
3.8%
Walking
1.4%
Bus
6.6%
Mount Claremont property information
Number of Bedrooms
Tenure Type
Property Types in Mount Claremont
Separate house
Semi detached house
Unit/Apartment
Median monthly mortgage repayments
$3,033
Median weekly rental payments
$420
Average number of bedrooms per dwelling
3.5
Average number of people per household
3
Household Composition
Family Composition
Couple family without children
One parent family
Couple family with children
MOUNT CLAREMONT planning zones
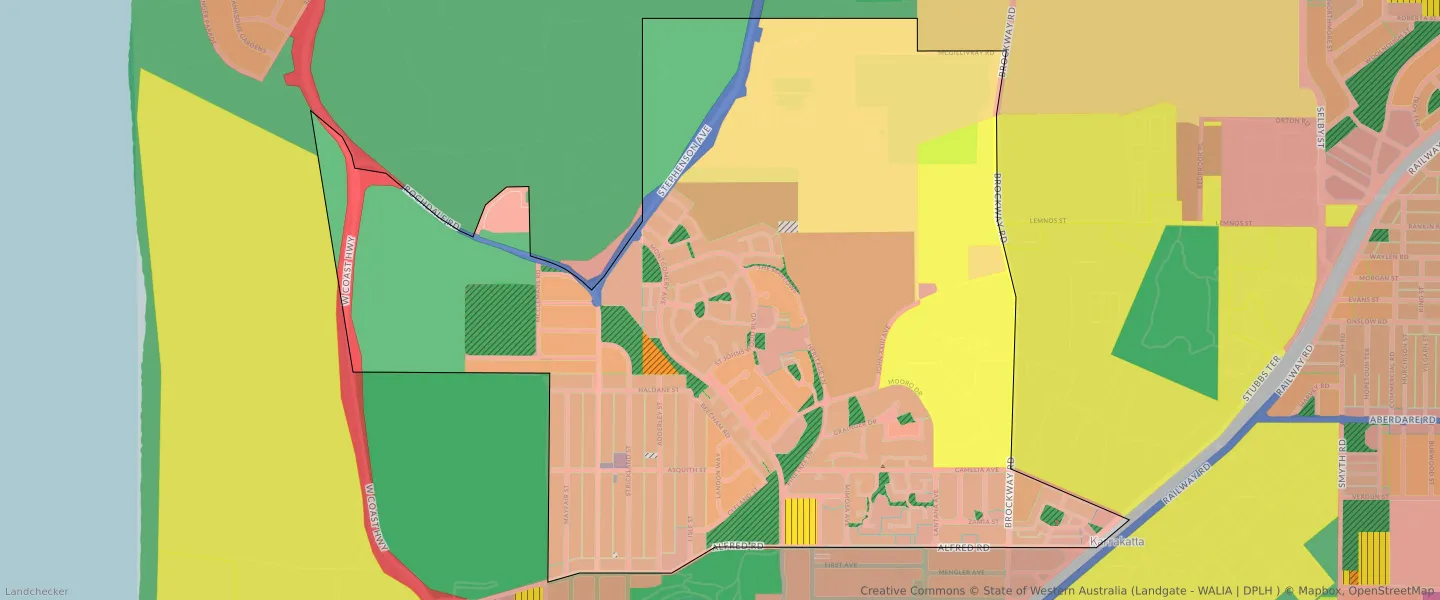
| Zone Code | Zone Name | Percentage Covered | Area Covered | |
|---|---|---|---|---|
| CIVIC AND COMMUNITY | CIVIC AND COMMUNITY | 0.32% | 13,866.58㎡ | |
| DRAINAGE AND WATERWAYS | DRAINAGE AND WATERWAYS | 0.11% | 4,889.52㎡ | |
| EDUCATION | EDUCATION | 0.55% | 23,725.4㎡ | |
| INFRASTRUCTURE SERVICES | INFRASTRUCTURE SERVICES | 0.02% | 704.9㎡ | |
| LOCAL CENTRE | LOCAL CENTRE | 0.1% | 4,425.08㎡ | |
| LOCAL ROAD | LOCAL ROAD | 0.19% | 8,108.18㎡ | |
| NO ZONE | NO ZONE | 0.01% | 384.65㎡ | |
| OTHER REGIONAL ROADS | OTHER REGIONAL ROADS RESERVE | 1.85% | 80,160.12㎡ | |
| PARKS AND RECREATION | PARKS AND RECREATION | 2.57% | 110,956.65㎡ | |
| PARKS AND RECREATION | PARKS AND RECREATION RESERVE | 2.57% | 110,956.65㎡ | |
| PRIMARY REGIONAL ROADS | PRIMARY REGIONAL ROADS RESERVE | 1.33% | 57,267.17㎡ | |
| PRIVATE COMMUNITY PURPOSES | PRIVATE COMMUNITY PURPOSES | 8.08% | 349,101.75㎡ | |
| PUBLIC OPEN SPACE | PUBLIC OPEN SPACE | 2.53% | 109,152.54㎡ | |
| PUBLIC PURPOSES - COMMONWEALTH GOVERNMENT | PUBLIC PURPOSES - COMMONWEALTH GOVERNMENT RESERVE | 0.26% | 11,099.6㎡ | |
| PUBLIC PURPOSES - HOSPITAL | PUBLIC PURPOSES - HOSPITAL RESERVE | 11.18% | 482,946.03㎡ | |
| PUBLIC PURPOSES - PUBLIC UTILITIES | PUBLIC PURPOSES - PUBLIC UTILITIES | 0.15% | 6,697.26㎡ | |
| PUBLIC PURPOSES - PUBLIC UTILITIES | PUBLIC PURPOSES - PUBLIC UTILITIES RESERVE | 0.15% | 6,697.26㎡ | |
| R12.5 | R12.5 | 5.27% | 227,585.24㎡ | |
| R20 | R20 | 14.7% | 635,003.8㎡ | |
| R25 | R25 | 3.43% | 148,303.56㎡ | |
| R30 | R30 | 2.1% | 90,872.72㎡ | |
| R40 | R40 | 1.12% | 48,603.23㎡ | |
| R50 | R50 | 0.7% | 30,188.65㎡ | |
| R60 | R60 | 0.27% | 11,716.14㎡ | |
| RAILWAYS | RAILWAYS RESERVE | 0.08% | 3,623.93㎡ | |
| RECREATION | RECREATION | 0.52% | 22,569.61㎡ | |
| REGIONAL OPEN SPACE | REGIONAL OPEN SPACE | 13.66% | 590,071.86㎡ | |
| REGIONAL OPEN SPACE | REGIONAL OPEN SPACE RESERVE | 13.66% | 590,071.86㎡ | |
| RESIDENTIAL | RESIDENTIAL | 2.98% | 128,742.61㎡ | |
| RESIDENTIAL | RESIDENTIAL | 24.66% | 1,065,588.46㎡ | |
| SERVICE COMMERCIAL | SERVICE COMMERCIAL | 0.08% | 3,523.35㎡ | |
| SPECIAL USE | SPECIAL USE | 0.54% | 23,431.56㎡ | |
| URBAN | URBAN | 71.49% | 3,089,216.67㎡ | |
| URBAN | URBAN ZONE | 71.49% | 3,089,216.67㎡ | |
| URBAN DEVELOPMENT | URBAN DEVELOPMENT | 16.68% | 720,963.12㎡ |
Looking to research a property in MOUNT CLAREMONT?
Go to mapData Source - ABS