Mooroolbark VIC 3138
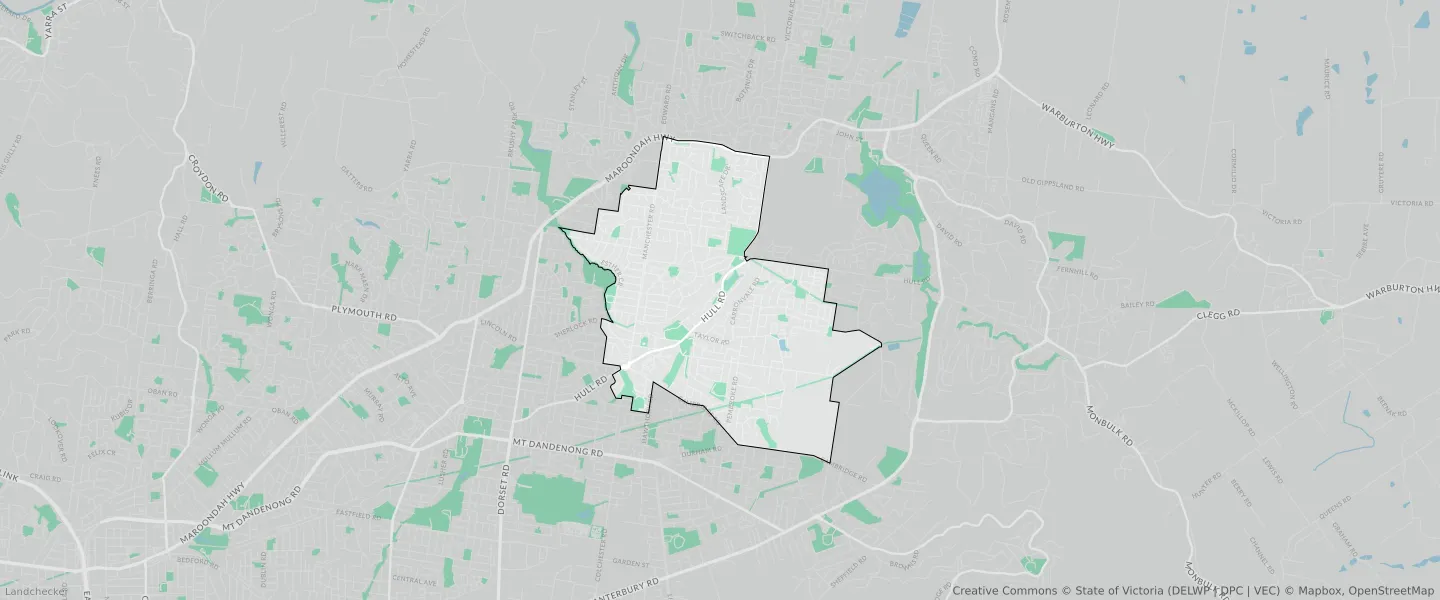
This Mooroolbark suburb profile includes demographic data and planning information to help you make an informed property decision.
An average home in Mooroolbark is owned with a mortgage by couples with children. The average age in Mooroolbark is 37. Separate houses are common in Mooroolbark and the area is mostly NEIGHBOURHOOD RESIDENTIAL ZONE (60.1%), GREEN WEDGE A ZONE (11.11%) and GENERAL RESIDENTIAL ZONE (7.28%).
Mooroolbark demographics
Population
23059
Average Age
37
Age Distribution
Employment Type
Median Weekly Income
Traveled to Work
Car
89.4%
Tram
0.0%
Bicycle
0.2%
Train
1.6%
Walking
0.9%
Bus
0.3%
Mooroolbark property information
Number of Bedrooms
Tenure Type
Property Types in Mooroolbark
Separate house
Semi detached house
Unit/Apartment
Median monthly mortgage repayments
$2,000
Median weekly rental payments
$400
Average number of bedrooms per dwelling
3.4
Average number of people per household
3
Household Composition
Family Composition
Couple family without children
One parent family
Couple family with children
MOOROOLBARK planning zones
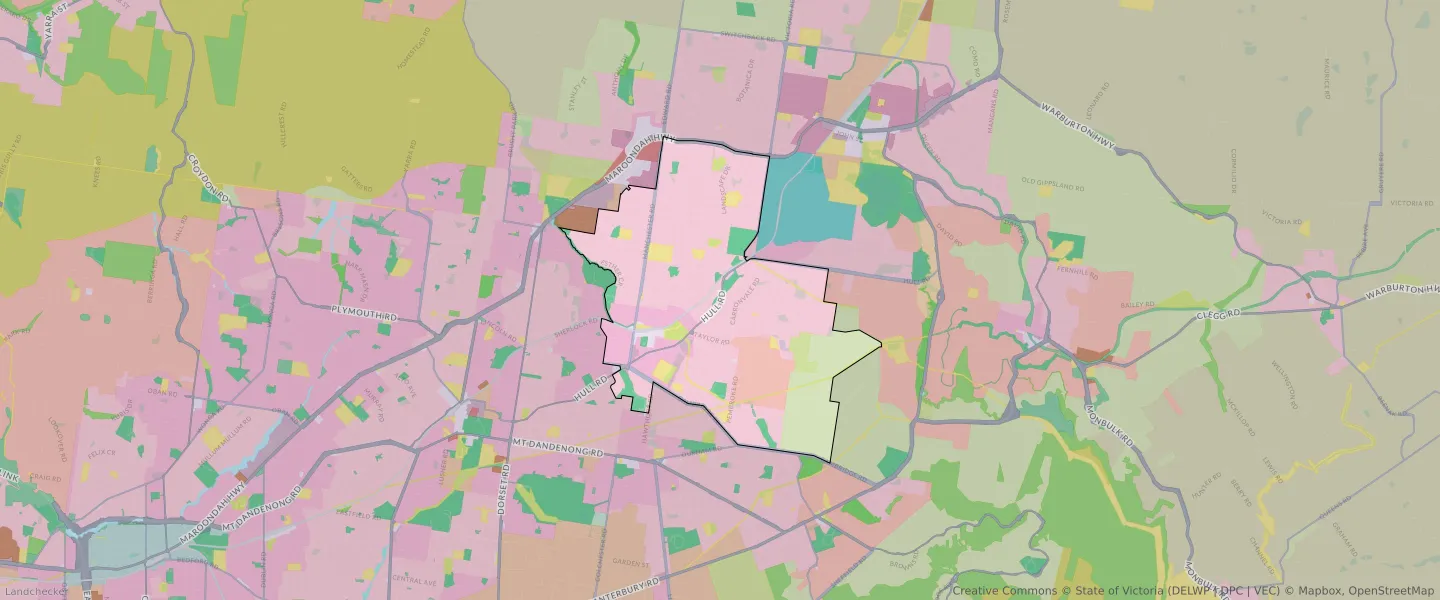
| Zone Code | Zone Name | Percentage Covered | Area Covered | |
|---|---|---|---|---|
| C1Z | COMMERCIAL 1 ZONE | 0.59% | 73,065.28㎡ | |
| C2Z | COMMERCIAL 2 ZONE | 0.17% | 20,618.51㎡ | |
| GRZ | GENERAL RESIDENTIAL ZONE | 7.28% | 902,388.24㎡ | |
| GWAZ | GREEN WEDGE A ZONE | 11.11% | 1,378,494.37㎡ | |
| IN3Z | INDUSTRIAL 3 ZONE | 0% | 16.21㎡ | |
| LDRZ | LOW DENSITY RESIDENTIAL ZONE | 6.19% | 767,757.18㎡ | |
| NRZ | NEIGHBOURHOOD RESIDENTIAL ZONE | 60.1% | 7,455,489.88㎡ | |
| PPRZ | PUBLIC PARK AND RECREATION ZONE | 4.49% | 556,354.07㎡ | |
| PUZ | PUBLIC USE ZONE | 4.73% | 586,604.29㎡ | |
| SUZ | SPECIAL USE ZONE | 1.27% | 156,979.12㎡ | |
| TRZ1 | TRANSPORT ZONE | 0.66% | 81,489.81㎡ | |
| TRZ2 | TRANSPORT ZONE | 1.21% | 150,679.15㎡ | |
| TRZ3 | TRANSPORT ZONE | 2.21% | 274,584.03㎡ |
Looking to research a property in MOOROOLBARK?
Go to mapData Source - ABS