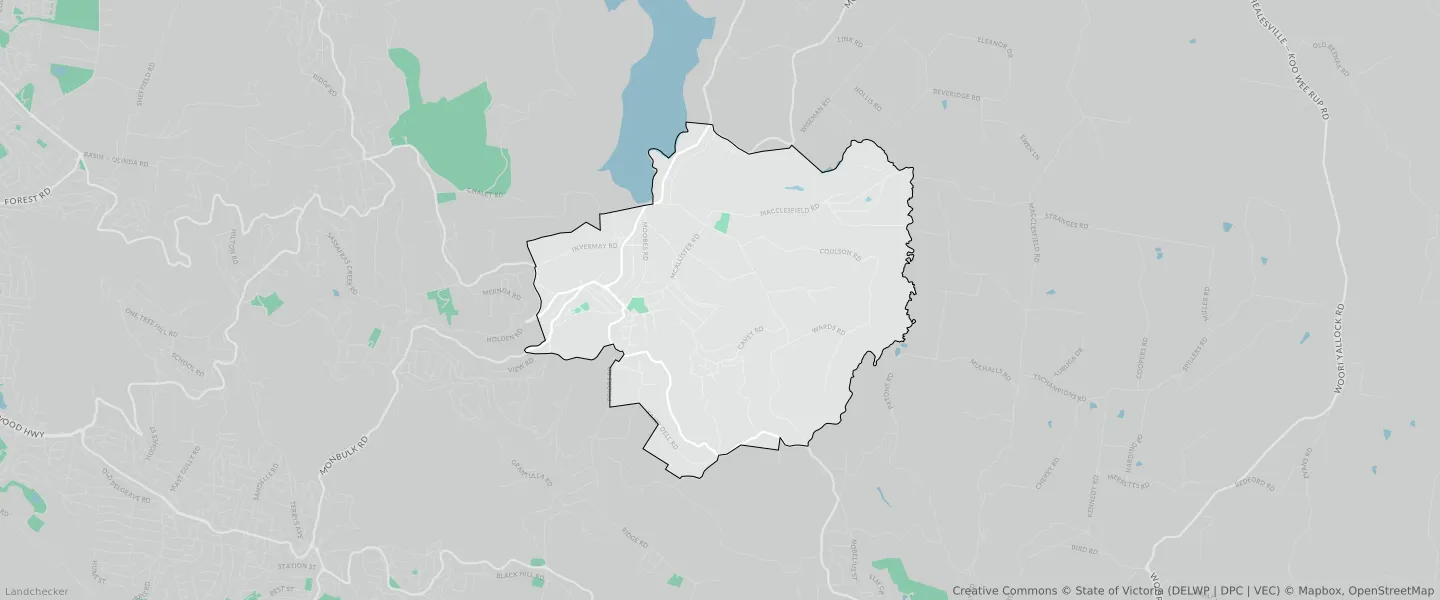
Monbulk VIC 3793
This Monbulk suburb profile includes demographic data and planning information to help you make an informed property decision.
An average home in Monbulk is owned with a mortgage by couples with children. The average age in Monbulk is 41. Separate houses are common in Monbulk and the area is mostly GREEN WEDGE ZONE (75.06%), LOW DENSITY RESIDENTIAL ZONE (8.05%) and PUBLIC CONSERVATION AND RESOURCE ZONE (5.81%).
Monbulk demographics
Population
3651
Average Age
41
Age Distribution
Employment Type
Median Weekly Income
Traveled to Work
Car
86.1%
Tram
0.0%
Bicycle
0.0%
Train
0.9%
Walking
5.0%
Bus
0.8%
Monbulk property information
Number of Bedrooms
Tenure Type
Property Types in Monbulk
Separate house
Semi detached house
Unit/Apartment
Median monthly mortgage repayments
$1,915
Median weekly rental payments
$369
Average number of bedrooms per dwelling
3.3
Average number of people per household
3
Household Composition
Family Composition
Couple family without children
One parent family
Couple family with children
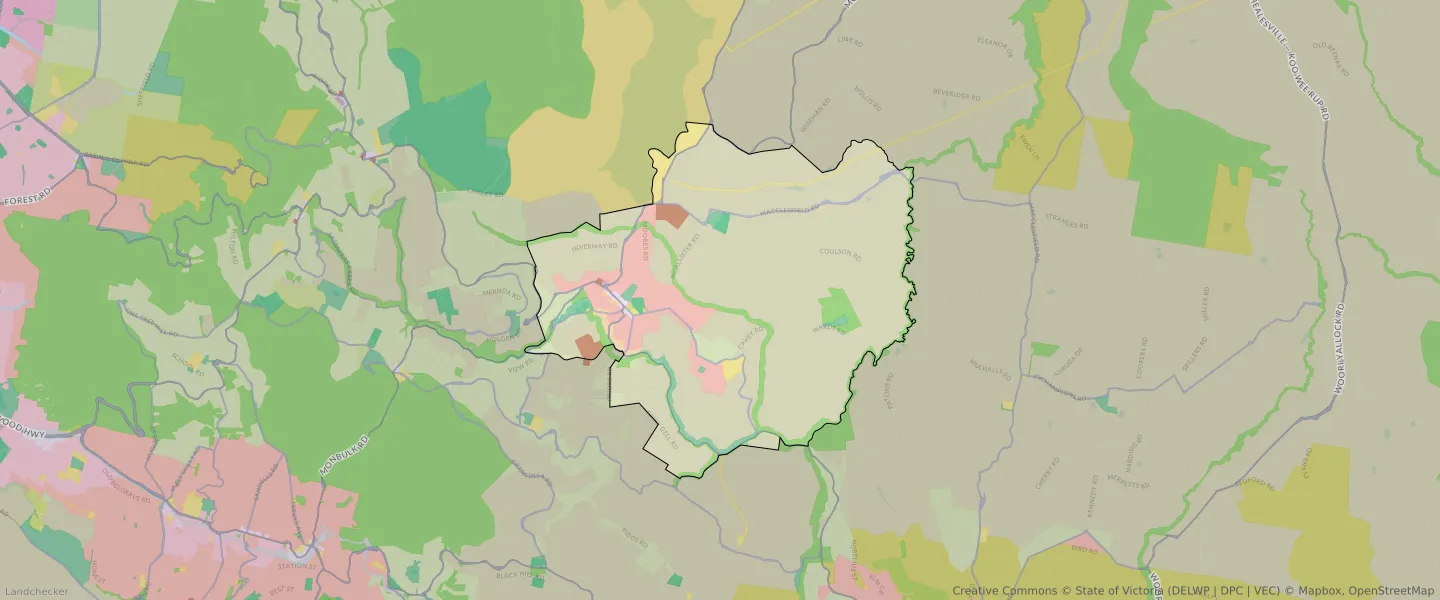
MONBULK planning zones
| Zone Code | Zone Name | Percentage Covered | Area Covered | |
|---|---|---|---|---|
| C1Z | COMMERCIAL 1 ZONE | 0.22% | 45,363.64㎡ | |
| C2Z | COMMERCIAL 2 ZONE | 0.03% | 5,802.65㎡ | |
| GWAZ | GREEN WEDGE A ZONE | 2.55% | 517,984.5㎡ | |
| GWZ | GREEN WEDGE ZONE | 75.06% | 15,224,103.87㎡ | |
| IN3Z | INDUSTRIAL 3 ZONE | 1.08% | 218,277.55㎡ | |
| LDRZ | LOW DENSITY RESIDENTIAL ZONE | 8.05% | 1,632,420.06㎡ | |
| PCRZ | PUBLIC CONSERVATION AND RESOURCE ZONE | 5.81% | 1,178,693.98㎡ | |
| PPRZ | PUBLIC PARK AND RECREATION ZONE | 2.11% | 428,644.54㎡ | |
| PUZ | PUBLIC USE ZONE | 2.31% | 468,362.2㎡ | |
| RLZ | RURAL LIVING ZONE | 0.5% | 101,308.41㎡ | |
| TRZ2 | TRANSPORT ZONE | 1.1% | 224,126.66㎡ | |
| TRZ3 | TRANSPORT ZONE | 1.17% | 238,011.72㎡ |
Looking to research a property in MONBULK?
Go to mapData Source - ABS