Mirrabooka NSW 2264
This Mirrabooka suburb profile includes demographic data and planning information to help you make an informed property decision.
An average home in Mirrabooka is owned with a mortgage by couples without children. The average age in Mirrabooka is 42. Separate houses are common in Mirrabooka and the area is mostly Environmental Living (42.32%), Primary Production Small Lots (19.94%) and Environmental Living (14.64%).
Mirrabooka demographics
Population
809
Average Age
42
Age Distribution
Employment Type
Median Weekly Income
Traveled to Work
Car
91.8%
Tram
0.0%
Bicycle
0.0%
Train
0.0%
Walking
1.2%
Bus
0.0%
Mirrabooka property information
Number of Bedrooms
Tenure Type
Property Types in Mirrabooka
Separate house
Semi detached house
Unit/Apartment
Median monthly mortgage repayments
$1,755
Median weekly rental payments
$368
Average number of bedrooms per dwelling
3.3
Average number of people per household
3
Household Composition
Family Composition
Couple family without children
One parent family
Couple family with children
MIRRABOOKA planning zones
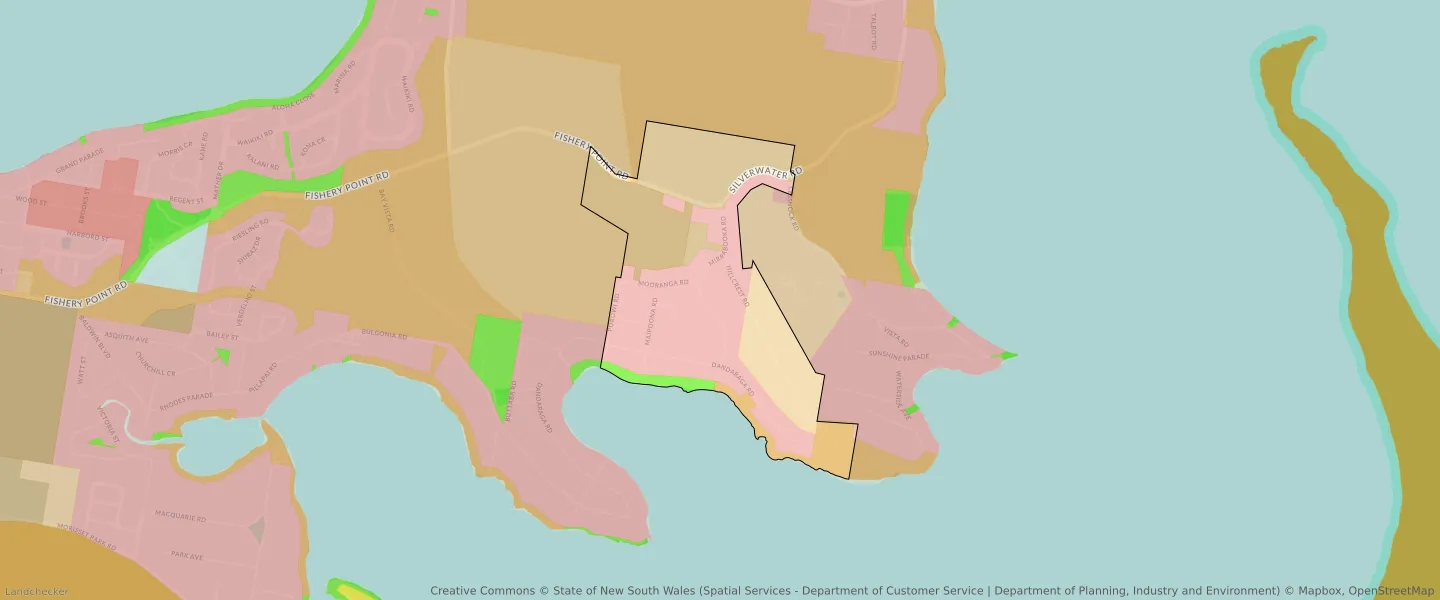
| Zone Code | Zone Name | Percentage Covered | Area Covered | |
|---|---|---|---|---|
| C2 | Environmental Conservation | 6.53% | 50,737.65㎡ | |
| C3 | Environmental Conservation | 0.57% | 4,440.38㎡ | |
| C4 | Environmental Living | 14.64% | 113,797.98㎡ | |
| R2 | Environmental Living | 42.32% | 328,933.53㎡ | |
| RE1 | Low Density Residential | 2.43% | 18,871.44㎡ | |
| RU4 | Primary Production Small Lots | 19.94% | 154,991.39㎡ | |
| RU6 | Transition | 13.57% | 105,477.5㎡ |
Looking to research a property in MIRRABOOKA?
Go to mapData Source - ABS