Minchinbury NSW 2770
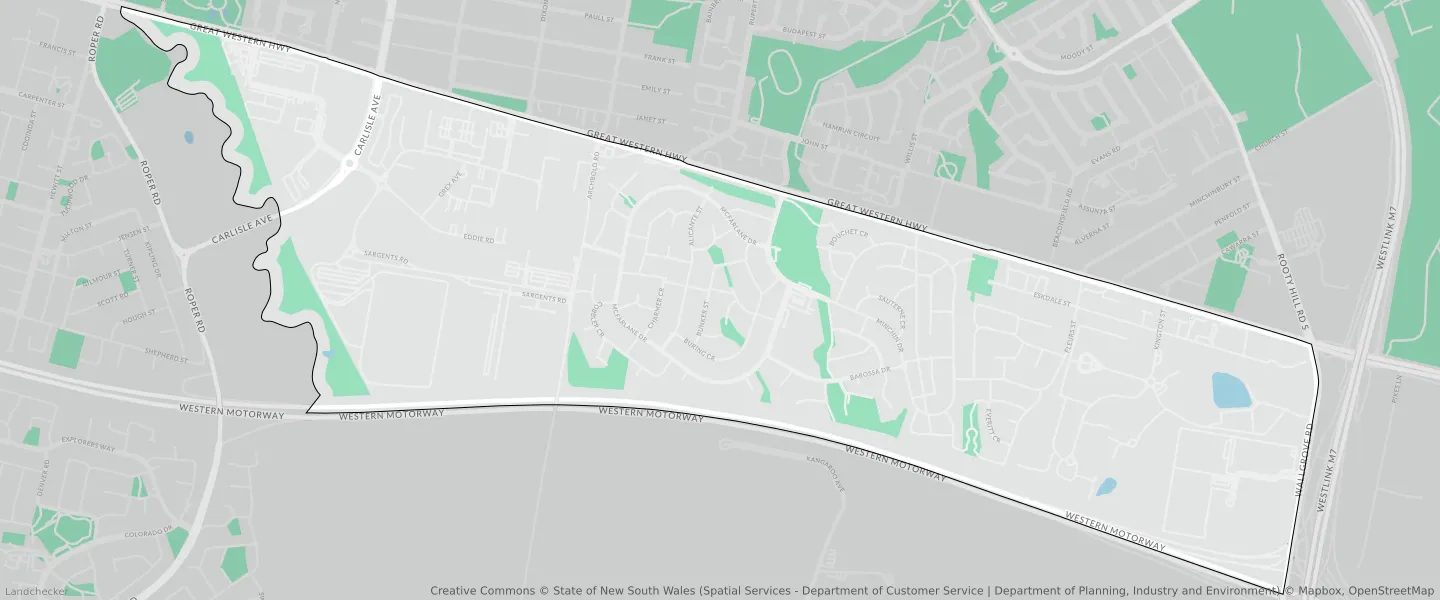
This Minchinbury suburb profile includes demographic data and planning information to help you make an informed property decision.
An average home in Minchinbury is owned with a mortgage by couples with children. The average age in Minchinbury is 35. Separate houses are common in Minchinbury and the area is mostly Environmental Living (32.72%), Business Development (28.82%) and Infrastructure (12.55%).
Minchinbury demographics
Population
5778
Average Age
35
Age Distribution
Employment Type
Median Weekly Income
Traveled to Work
Car
85.3%
Tram
0.0%
Bicycle
0.0%
Train
1.5%
Walking
1.1%
Bus
0.7%
Minchinbury property information
Number of Bedrooms
Tenure Type
Property Types in Minchinbury
Separate house
Semi detached house
Unit/Apartment
Median monthly mortgage repayments
$2,167
Median weekly rental payments
$450
Average number of bedrooms per dwelling
3.7
Average number of people per household
3
Household Composition
Family Composition
Couple family without children
One parent family
Couple family with children
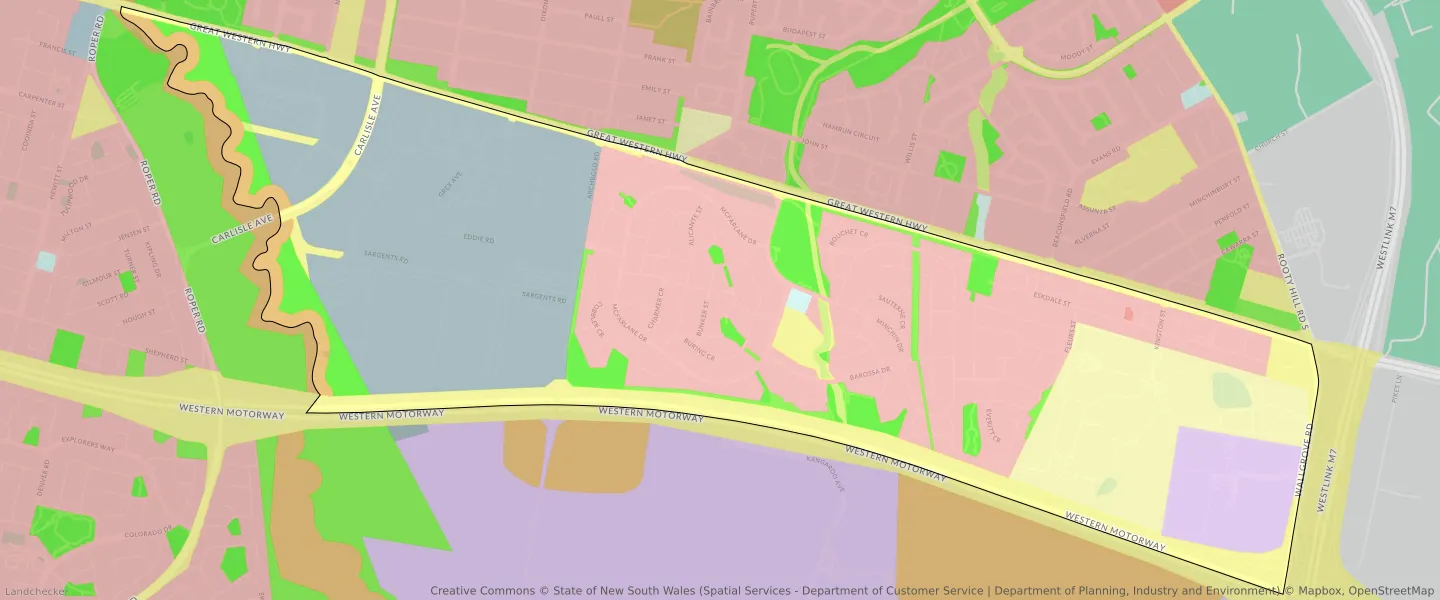
MINCHINBURY planning zones
| Zone Code | Zone Name | Percentage Covered | Area Covered | |
|---|---|---|---|---|
| C2 | Environmental Conservation | 0% | 29.61㎡ | |
| C2 | Environmental Conservation | 2.62% | 118,352.26㎡ | |
| E1 | Local Centre | 0.15% | 6,779.33㎡ | |
| E3 | Business Development | 28.82% | 1,299,297.65㎡ | |
| IN1 | General Industrial | 4.85% | 218,658.2㎡ | |
| R2 | Environmental Living | 32.72% | 1,475,234.84㎡ | |
| R3 | Medium Density Residential | 0.03% | 1,179.05㎡ | |
| RE1 | Low Density Residential | 7.07% | 318,705.02㎡ | |
| SP1 | Infrastructure | 11.2% | 504,779.18㎡ | |
| SP2 | Infrastructure | 12.55% | 565,616.63㎡ |
Looking to research a property in MINCHINBURY?
Go to mapData Source - ABS