Milperra NSW 2214
This Milperra suburb profile includes demographic data and planning information to help you make an informed property decision.
An average home in Milperra is owned with a mortgage by couples with children. The average age in Milperra is 39. Separate houses are common in Milperra and the area is mostly Environmental Living (22.74%), Private Recreation (20.47%) and Low Density Residential (19.86%).
Milperra demographics
Population
4074
Average Age
39
Age Distribution
Employment Type
Median Weekly Income
Traveled to Work
Car
85.2%
Tram
0.0%
Bicycle
0.0%
Train
2.8%
Walking
1.4%
Bus
0.4%
Milperra property information
Number of Bedrooms
Tenure Type
Property Types in Milperra
Separate house
Semi detached house
Unit/Apartment
Median monthly mortgage repayments
$2,600
Median weekly rental payments
$538
Average number of bedrooms per dwelling
3.6
Average number of people per household
3
Household Composition
Family Composition
Couple family without children
One parent family
Couple family with children
MILPERRA planning zones
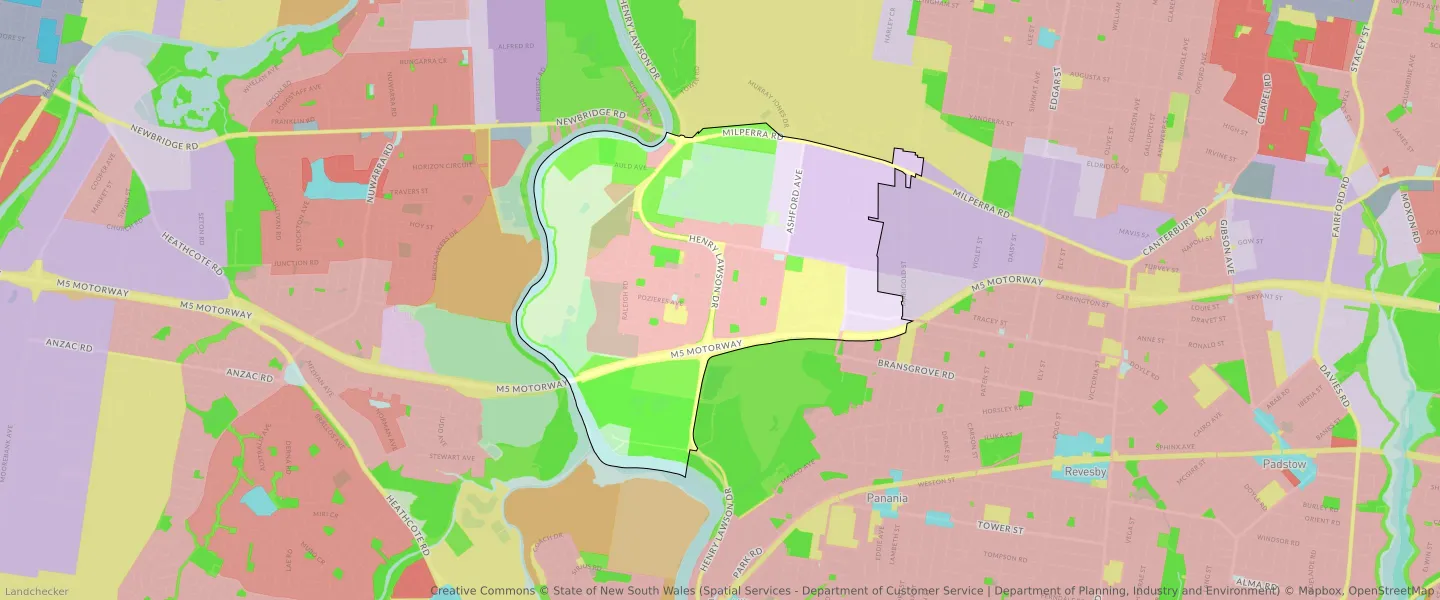
| Zone Code | Zone Name | Percentage Covered | Area Covered | |
|---|---|---|---|---|
| C2 | Environmental Conservation | 0.37% | 20,297.21㎡ | |
| E1 | Local Centre | 0.27% | 15,201.39㎡ | |
| E4 | General Industrial | 18.14% | 1,003,056㎡ | |
| R1 | General Residential | 2.76% | 152,526.49㎡ | |
| R2 | Environmental Living | 22.74% | 1,257,475.28㎡ | |
| RE1 | Low Density Residential | 19.86% | 1,098,397.52㎡ | |
| RE2 | Private Recreation | 20.47% | 1,132,386.83㎡ | |
| RU4 | Primary Production Small Lots | 1.43% | 79,270.62㎡ | |
| SP2 | Infrastructure | 9.03% | 499,356.44㎡ | |
| W1 | Environmental Living | 4.82% | 266,796㎡ | |
| W1 | Environmental Living | 0.01% | 388.68㎡ |
Looking to research a property in MILPERRA?
Go to mapData Source - ABS