Midland WA 6056
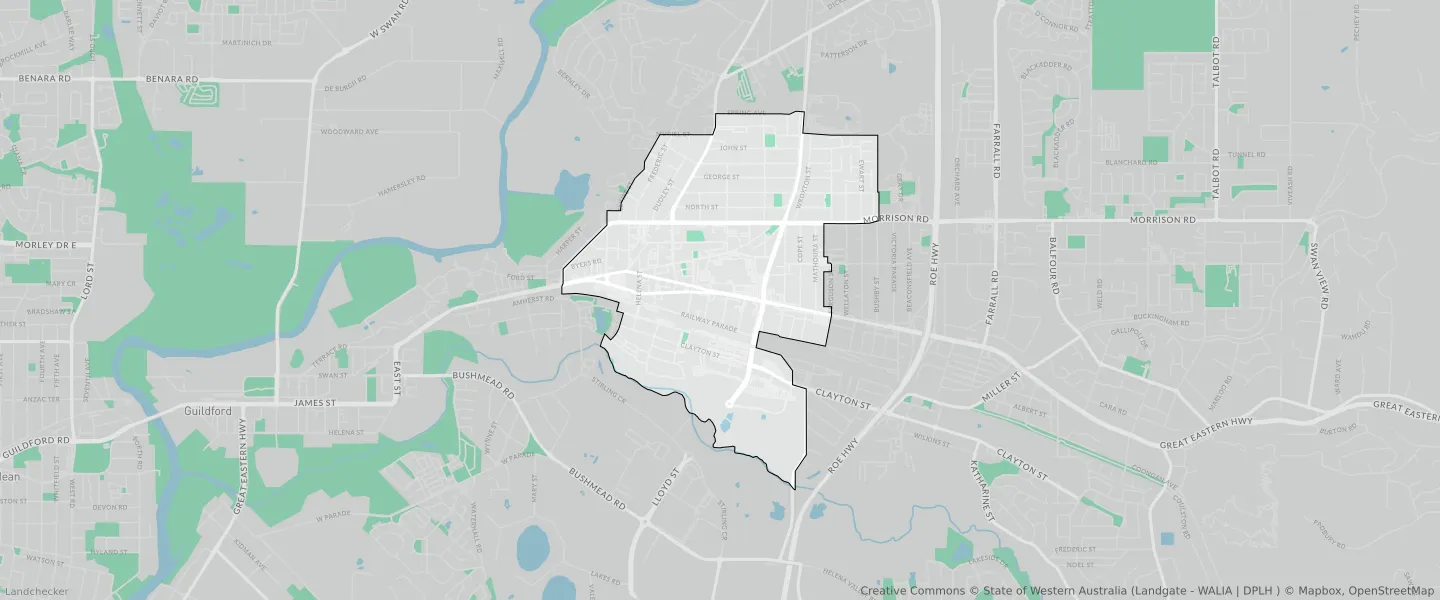
This Midland suburb profile includes demographic data and planning information to help you make an informed property decision.
An average home in Midland is rented by single person households. The average age in Midland is 39. Semi detached houses are common in Midland and the area is mostly URBAN ZONE (46.75%), URBAN (46.75%) and CENTRAL CITY AREA ZONE (32.36%).
Midland demographics
Population
6335
Average Age
39
Age Distribution
Employment Type
Median Weekly Income
Traveled to Work
Car
75.5%
Tram
0.0%
Bicycle
1.4%
Train
2.7%
Walking
5.6%
Bus
3.1%
Midland property information
Number of Bedrooms
Tenure Type
Property Types in Midland
Separate house
Semi detached house
Unit/Apartment
Median monthly mortgage repayments
$1,350
Median weekly rental payments
$295
Average number of bedrooms per dwelling
2.6
Average number of people per household
2
Household Composition
Family Composition
Couple family without children
One parent family
Couple family with children
MIDLAND planning zones
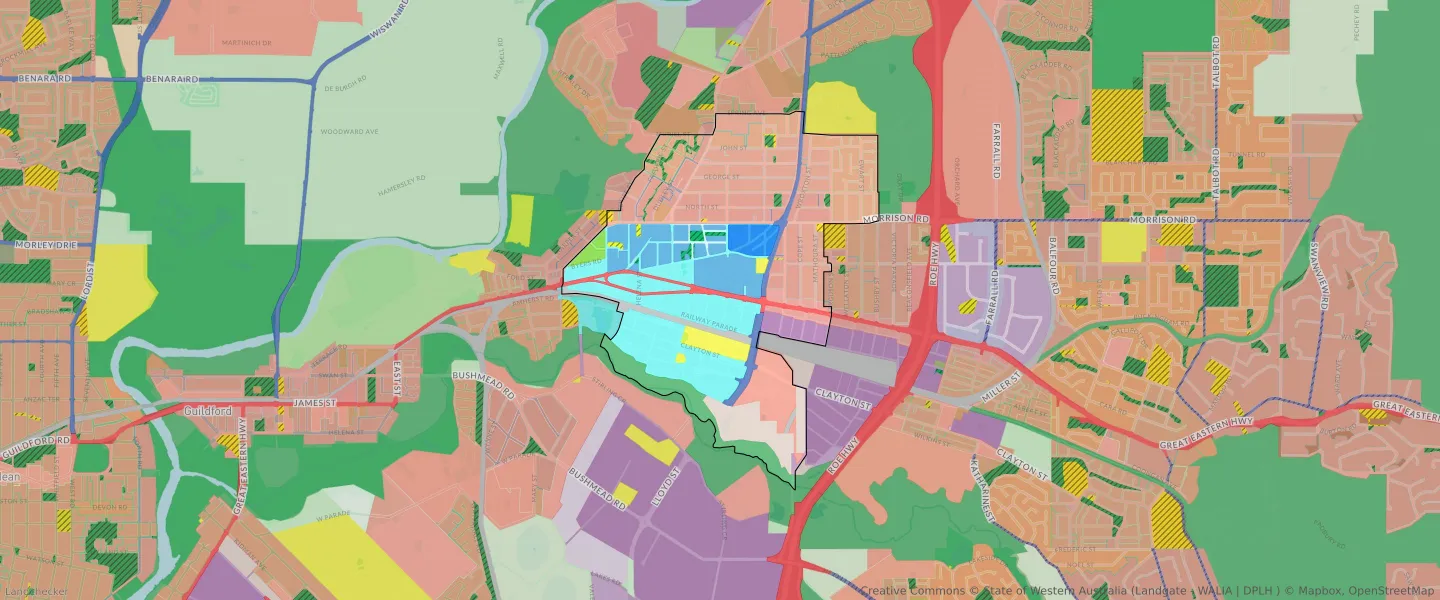
| Zone Code | Zone Name | Percentage Covered | Area Covered | |
|---|---|---|---|---|
| CENTRAL CITY AREA | CENTRAL CITY AREA ZONE | 32.36% | 1,412,293.71㎡ | |
| GENERAL COMMERCIAL | GENERAL COMMERCIAL | 0.11% | 4,726.45㎡ | |
| GENERAL INDUSTRIAL | GENERAL INDUSTRIAL | 1.67% | 72,942.81㎡ | |
| HIGHWAY SERVICE | HIGHWAY SERVICE | 1.46% | 63,616.42㎡ | |
| INDUSTRIAL | INDUSTRIAL | 7.37% | 321,461.3㎡ | |
| INDUSTRIAL | INDUSTRIAL ZONE | 7.37% | 321,461.3㎡ | |
| INDUSTRIAL DEVELOPMENT | INDUSTRIAL DEVELOPMENT | 4.98% | 217,223.65㎡ | |
| LOCAL ROAD | LOCAL ROAD | 0.5% | 21,785.45㎡ | |
| MIDLAND STRATEGIC REGIONAL CENTRE | MIDLAND STRATEGIC REGIONAL CENTRE | 10.86% | 473,790.07㎡ | |
| OTHER REGIONAL ROADS | OTHER REGIONAL ROADS RESERVE | 2.43% | 106,011.28㎡ | |
| PRIMARY REGIONAL ROADS | PRIMARY REGIONAL ROADS RESERVE | 2.07% | 90,393.8㎡ | |
| PRIVATE CLUBS AND INSTITUTIONS | PRIVATE CLUBS AND INSTITUTIONS | 0.29% | 12,613.14㎡ | |
| PUBLIC OPEN SPACE | PUBLIC OPEN SPACE | 0.44% | 19,112.92㎡ | |
| PUBLIC PURPOSES | PUBLIC PURPOSES | 0.45% | 19,595.82㎡ | |
| PUBLIC PURPOSES | PUBLIC PURPOSES RESERVE | 0.45% | 19,595.82㎡ | |
| PUBLIC PURPOSES - HOSPITAL | PUBLIC PURPOSES - HOSPITAL RESERVE | 1.84% | 80,427.52㎡ | |
| PUBLIC PURPOSES - PUBLIC UTILITIES | PUBLIC PURPOSES - PUBLIC UTILITIES | 0.24% | 10,517.73㎡ | |
| PUBLIC PURPOSES - PUBLIC UTILITIES | PUBLIC PURPOSES - PUBLIC UTILITIES RESERVE | 0.24% | 10,517.73㎡ | |
| PUBLIC PURPOSES - TERTIARY EDUCATION | PUBLIC PURPOSES - TERTIARY EDUCATION | 0.13% | 5,774㎡ | |
| R100 | R100 | 0.84% | 36,803.99㎡ | |
| R20 | R20 | 2.58% | 112,451.87㎡ | |
| R20/35 | R20/35 | 3.1% | 135,356.79㎡ | |
| R20/40 | R20/40 | 2.08% | 90,778.23㎡ | |
| R20/50 | R20/50 | 1.54% | 67,125.73㎡ | |
| R20/60 | R20/60 | 0.22% | 9,555.56㎡ | |
| R40 | R40 | 1.5% | 65,636.6㎡ | |
| R40/60 | R40/60 | 6.81% | 297,228.78㎡ | |
| R40/80 | R40/80 | 2.61% | 114,081.96㎡ | |
| R60 | R60 | 2.58% | 112,391.33㎡ | |
| R60/100 | R60/100 | 2.09% | 91,299.09㎡ | |
| R60/80 | R60/80 | 5.23% | 228,113.29㎡ | |
| R80 | R80 | 2.09% | 91,280.7㎡ | |
| RAILWAYS | RAILWAYS RESERVE | 1.77% | 77,243.39㎡ | |
| RECREATION | RECREATION | 0.99% | 43,336.07㎡ | |
| REGIONAL OPEN SPACE | REGIONAL OPEN SPACE | 5.03% | 219,613.24㎡ | |
| REGIONAL OPEN SPACE | REGIONAL OPEN SPACE RESERVE | 5.03% | 219,613.24㎡ | |
| RESIDENTIAL | RESIDENTIAL | 28.79% | 1,256,631.46㎡ | |
| URBAN | URBAN | 46.75% | 2,040,224.52㎡ | |
| URBAN | URBAN ZONE | 46.75% | 2,040,224.52㎡ |
Looking to research a property in MIDLAND?
Go to mapData Source - ABS