Medowie NSW 2318
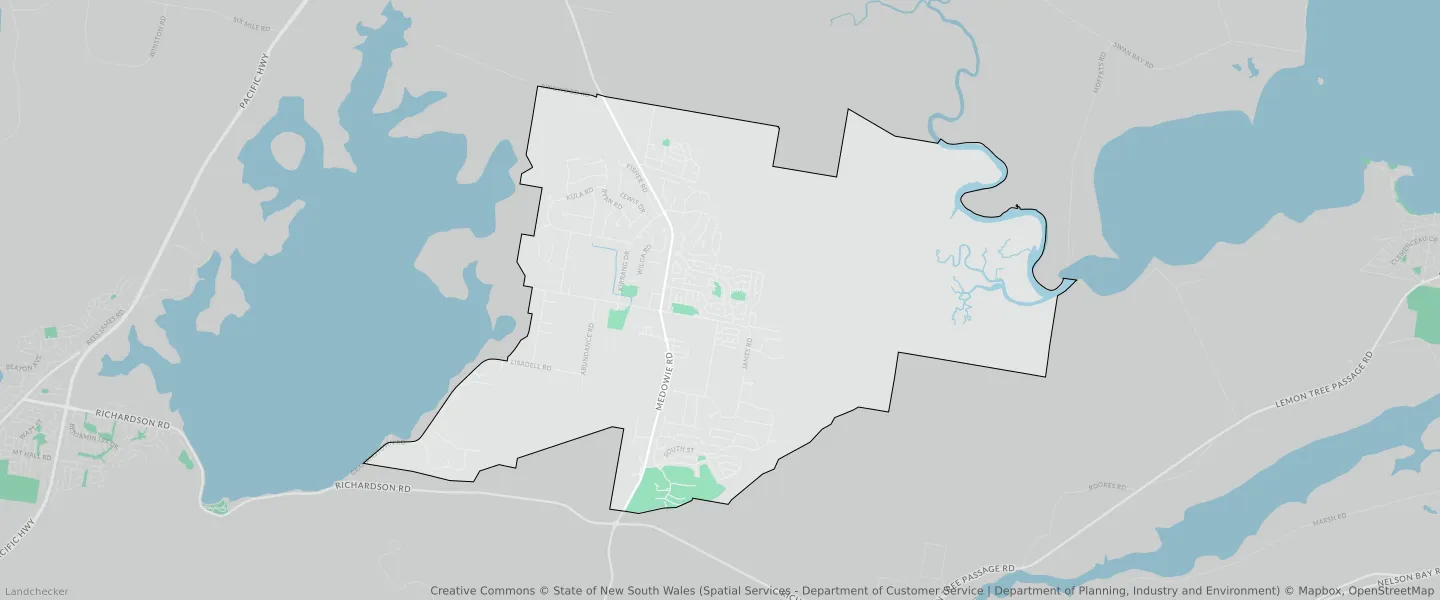
This Medowie suburb profile includes demographic data and planning information to help you make an informed property decision.
An average home in Medowie is owned with a mortgage by couples with children. The average age in Medowie is 37. Separate houses are common in Medowie and the area is mostly Infrastructure (30.53%), Large Lot Residential (26.28%) and Rural Landscape (14.6%).
Medowie demographics
Population
10879
Average Age
37
Age Distribution
Employment Type
Median Weekly Income
Traveled to Work
Car
90.2%
Tram
0.0%
Bicycle
0.3%
Train
0.0%
Walking
1.3%
Bus
0.4%
Medowie property information
Number of Bedrooms
Tenure Type
Property Types in Medowie
Separate house
Semi detached house
Unit/Apartment
Median monthly mortgage repayments
$1,950
Median weekly rental payments
$430
Average number of bedrooms per dwelling
3.7
Average number of people per household
3
Household Composition
Family Composition
Couple family without children
One parent family
Couple family with children
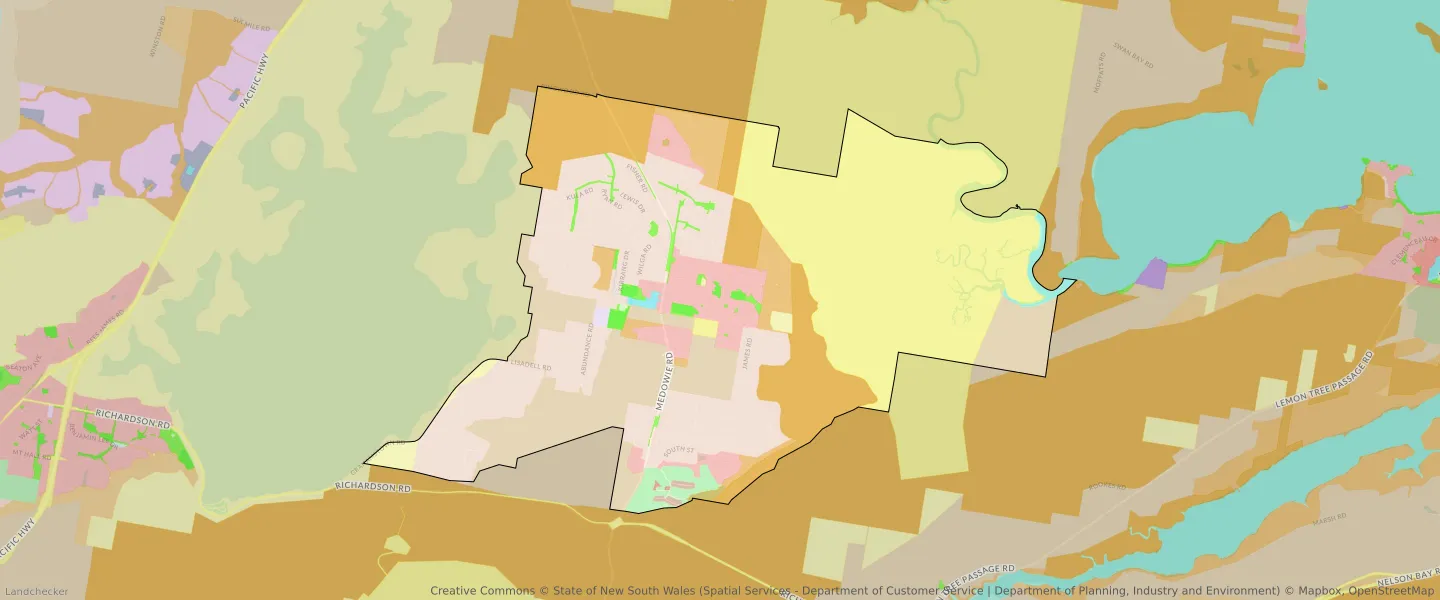
MEDOWIE planning zones
| Zone Code | Zone Name | Percentage Covered | Area Covered | |
|---|---|---|---|---|
| C1 | National Parks and Nature Reserves | 14.46% | 6,191,203.3㎡ | |
| C2 | Environmental Conservation | 2.68% | 1,147,599.42㎡ | |
| E1 | Local Centre | 0.19% | 79,423.7㎡ | |
| E4 | General Industrial | 0.18% | 75,092.76㎡ | |
| R2 | Environmental Living | 6.54% | 2,800,089.72㎡ | |
| R3 | Medium Density Residential | 0.03% | 14,601.34㎡ | |
| R5 | Large Lot Residential | 26.28% | 11,254,129.72㎡ | |
| RE1 | Low Density Residential | 1.32% | 565,172.29㎡ | |
| RE2 | Private Recreation | 1.45% | 621,446.11㎡ | |
| RU2 | Rural Landscape | 14.6% | 6,248,859.5㎡ | |
| SP1 | Infrastructure | 1.15% | 491,659.13㎡ | |
| SP2 | Infrastructure | 30.53% | 13,073,588.56㎡ | |
| W2 | Recreational Waterways | 0.6% | 257,372.64㎡ |
Looking to research a property in MEDOWIE?
Go to mapData Source - ABS