Manningham SA 5086
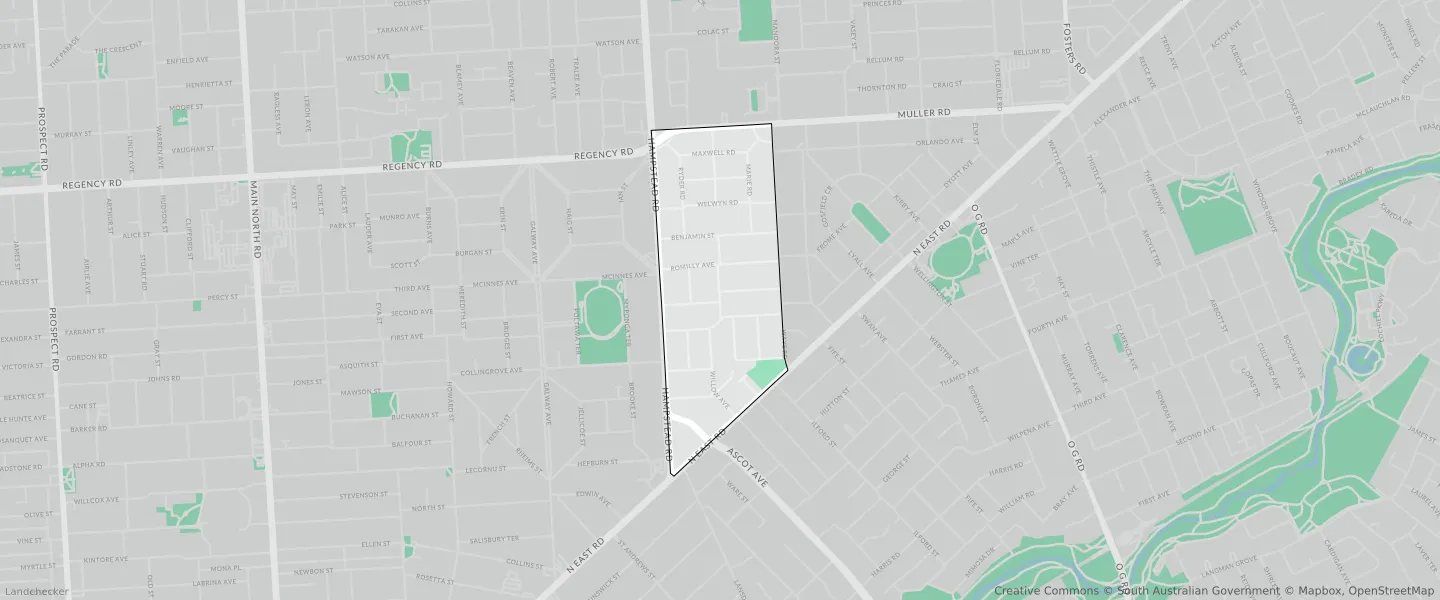
This Manningham suburb profile includes demographic data and planning information to help you make an informed property decision.
An average home in Manningham is owned with a mortgage by couples with children. The average age in Manningham is 39. Separate houses are common in Manningham and the area is mostly ESTABLISHED NEIGHBOURHOOD (94%), GENERAL NEIGHBOURHOOD (4.26%) and SUBURBAN ACTIVITY CENTRE (0.86%).
Manningham demographics
Population
1391
Average Age
39
Age Distribution
Employment Type
Median Weekly Income
Traveled to Work
Car
82.5%
Tram
0.0%
Bicycle
1.5%
Train
0.0%
Walking
1.9%
Bus
7.5%
Manningham property information
Number of Bedrooms
Tenure Type
Property Types in Manningham
Separate house
Semi detached house
Unit/Apartment
Median monthly mortgage repayments
$2,000
Median weekly rental payments
$320
Average number of bedrooms per dwelling
3.1
Average number of people per household
3
Household Composition
Family Composition
Couple family without children
One parent family
Couple family with children
MANNINGHAM planning zones
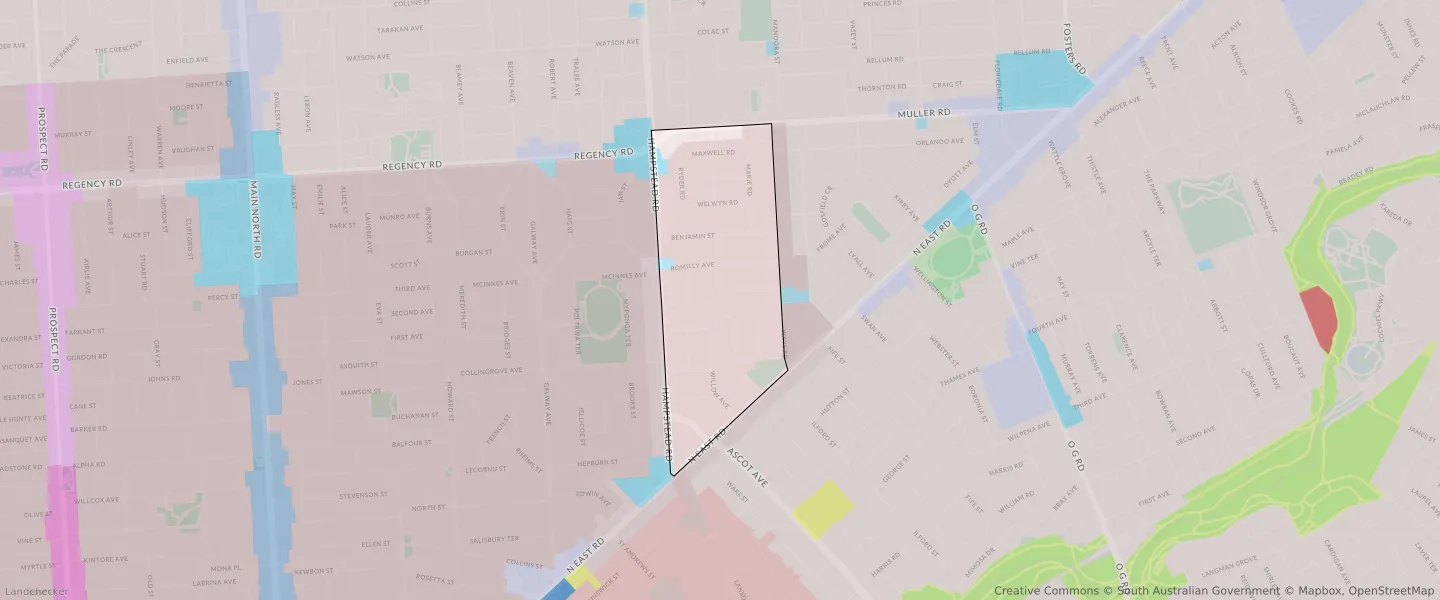
| Zone Code | Zone Name | Percentage Covered | Area Covered | |
|---|---|---|---|---|
| EN | ESTABLISHED NEIGHBOURHOOD | 94% | 516,949.11㎡ | |
| GN | GENERAL NEIGHBOURHOOD | 4.26% | 23,453.95㎡ | |
| HDN | HOUSING DIVERSITY NEIGHBOURHOOD | 0.46% | 2,551.06㎡ | |
| LAC | LOCAL ACTIVITY CENTRE | 0.41% | 2,280.83㎡ | |
| SAC | SUBURBAN ACTIVITY CENTRE | 0.86% | 4,727.52㎡ |
Looking to research a property in MANNINGHAM?
Go to mapData Source - ABS