Leppington NSW 2179
This Leppington suburb profile includes demographic data and planning information to help you make an informed property decision.
An average home in Leppington is owned with a mortgage by couples with children. The average age in Leppington is 32. Separate houses are common in Leppington and the area is mostly Primary Production Small Lots (38.64%), Environmental Living (19.93%) and Infrastructure (7.74%).
Leppington demographics
Population
9423
Average Age
32
Age Distribution
Employment Type
Median Weekly Income
Traveled to Work
Car
85.5%
Tram
0.0%
Bicycle
0.0%
Train
3.6%
Walking
0.8%
Bus
0.2%
Leppington property information
Number of Bedrooms
Tenure Type
Property Types in Leppington
Separate house
Semi detached house
Unit/Apartment
Median monthly mortgage repayments
$2,700
Median weekly rental payments
$550
Average number of bedrooms per dwelling
3.8
Average number of people per household
3
Household Composition
Family Composition
Couple family without children
One parent family
Couple family with children
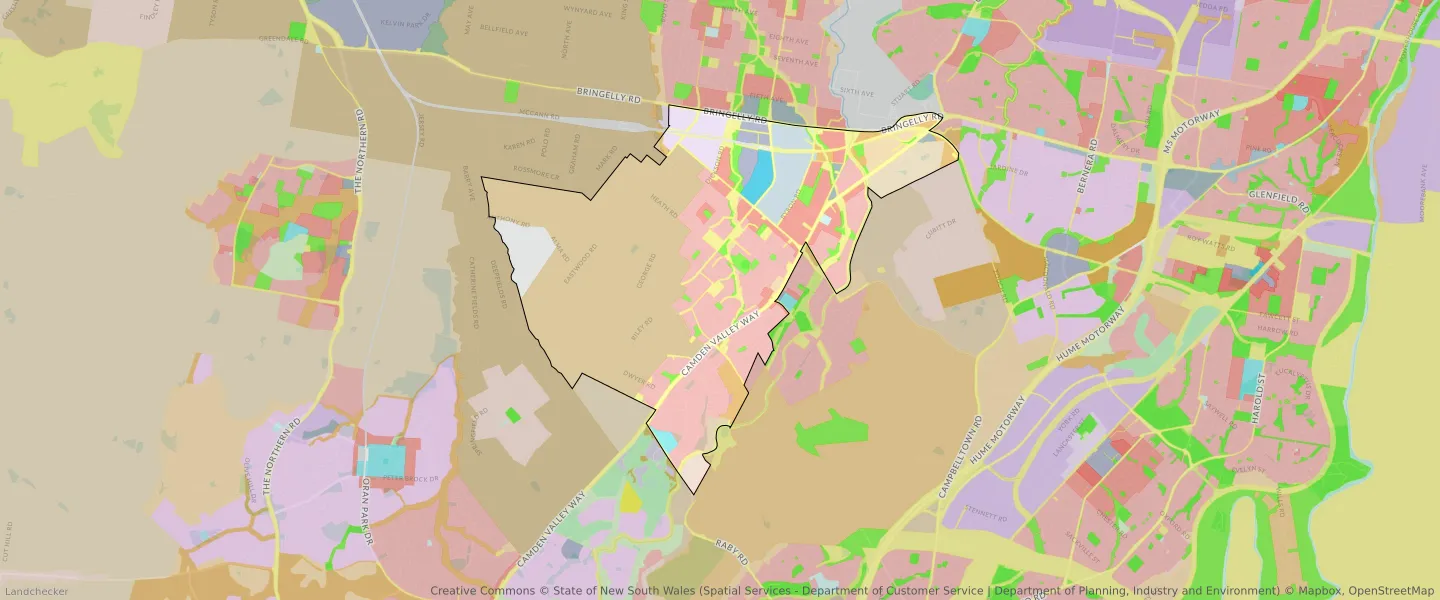
LEPPINGTON planning zones
| Zone Code | Zone Name | Percentage Covered | Area Covered | |
|---|---|---|---|---|
| B1 | Neighbourhood Centre | 0.11% | 22,715.49㎡ | |
| B3 | Commercial Core | 1.15% | 242,914.17㎡ | |
| B4 | Mixed Use | 1.4% | 295,854.38㎡ | |
| B5 | Business Development | 0.18% | 39,089.78㎡ | |
| B5 | Business Development | 0.1% | 20,132.95㎡ | |
| B7 | Business Park | 3.46% | 732,245.5㎡ | |
| C2 | Environmental Conservation | 1.21% | 256,430.18㎡ | |
| C2 | Environmental Conservation | 1.36% | 288,619.11㎡ | |
| C4 | Environmental Living | 1.2% | 254,641.92㎡ | |
| C4 | Environmental Living | 0.36% | 75,600.31㎡ | |
| E1 | Local Centre | 0.41% | 86,347.81㎡ | |
| IN2 | Light Industrial | 2.65% | 560,641.84㎡ | |
| PRR | Public Recreation - Regional | 2.99% | 633,012.41㎡ | |
| R2 | Environmental Living | 2.81% | 594,031.59㎡ | |
| R2 | Environmental Living | 19.93% | 4,218,252.29㎡ | |
| R3 | Medium Density Residential | 0.81% | 171,541.31㎡ | |
| R3 | Medium Density Residential | 4.62% | 977,999.67㎡ | |
| R5 | Large Lot Residential | 0.79% | 167,397.63㎡ | |
| RE1 | Low Density Residential | 0.45% | 94,477.67㎡ | |
| RE1 | Low Density Residential | 2.01% | 425,222.14㎡ | |
| RE2 | Private Recreation | 0.03% | 5,912.82㎡ | |
| RU1 | Primary Production | 2.71% | 573,246.26㎡ | |
| RU2 | Rural Landscape | 0.54% | 115,156.06㎡ | |
| RU4 | Primary Production Small Lots | 38.64% | 8,179,239.56㎡ | |
| RU6 | Transition | 0.01% | 2,859.6㎡ | |
| SP2 | Infrastructure | 1.45% | 307,085㎡ | |
| SP2 | Infrastructure | 0.51% | 107,012.98㎡ | |
| SP2 | Infrastructure | 7.74% | 1,637,400.09㎡ |
Looking to research a property in LEPPINGTON?
Go to mapData Source - ABS