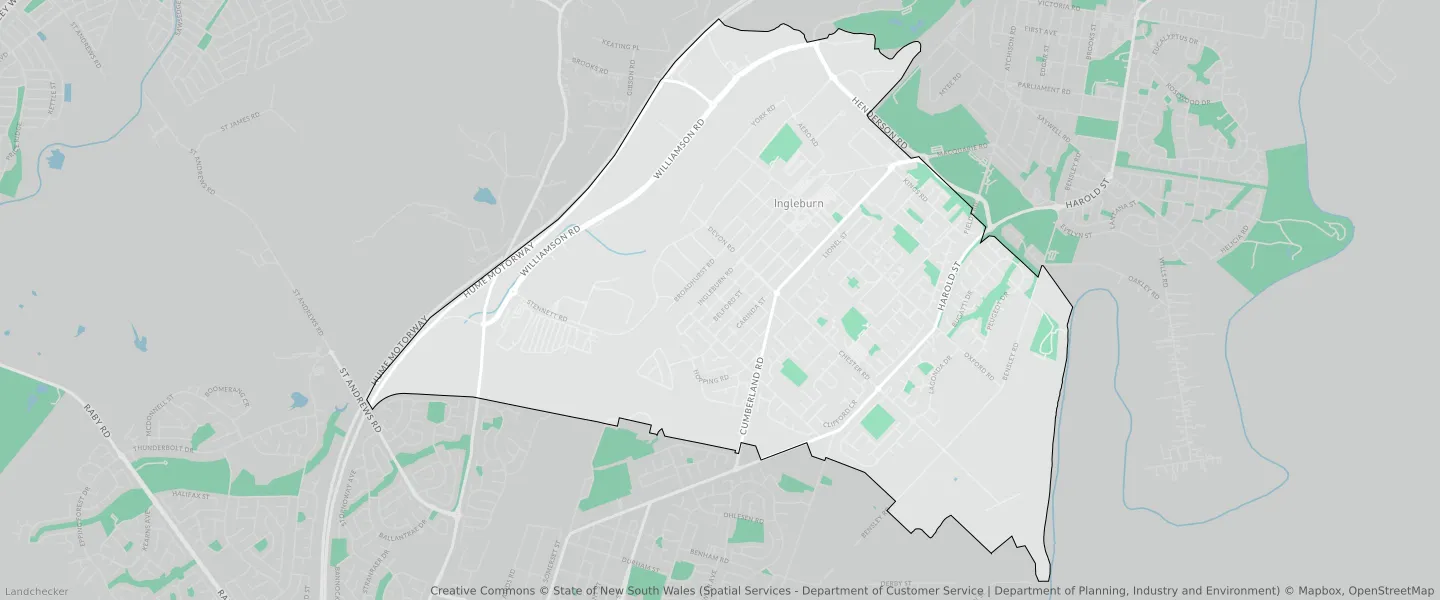
Ingleburn NSW 2565
This Ingleburn suburb profile includes demographic data and planning information to help you make an informed property decision.
An average home in Ingleburn is owned with a mortgage by couples with children. The average age in Ingleburn is 37. Separate houses are common in Ingleburn and the area is mostly General Industrial (28%), Environmental Living (24.24%) and Infrastructure (21.56%).
Ingleburn demographics
Population
15264
Average Age
37
Age Distribution
Employment Type
Median Weekly Income
Traveled to Work
Car
75.1%
Tram
0.0%
Bicycle
0.5%
Train
10.0%
Walking
3.2%
Bus
0.9%
Ingleburn property information
Number of Bedrooms
Tenure Type
Property Types in Ingleburn
Separate house
Semi detached house
Unit/Apartment
Median monthly mortgage repayments
$1,950
Median weekly rental payments
$380
Average number of bedrooms per dwelling
3.2
Average number of people per household
3
Household Composition
Family Composition
Couple family without children
One parent family
Couple family with children
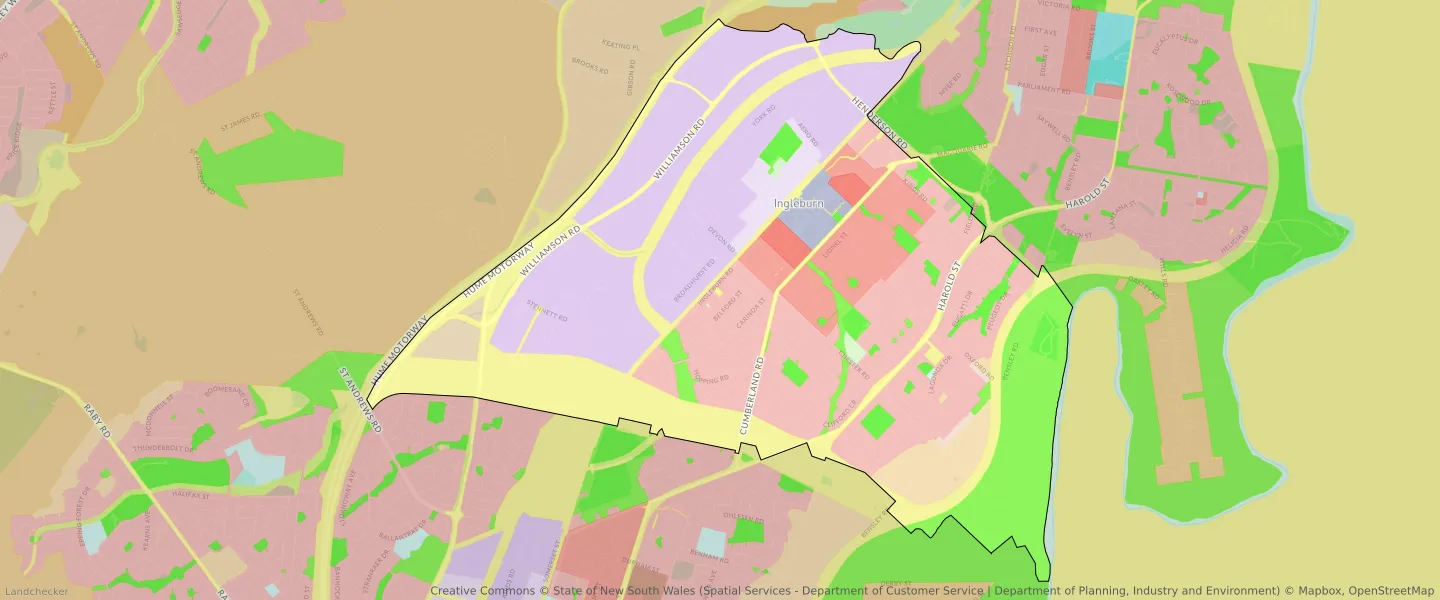
INGLEBURN planning zones
| Zone Code | Zone Name | Percentage Covered | Area Covered | |
|---|---|---|---|---|
| C4 | Environmental Living | 3.01% | 371,621.39㎡ | |
| E1 | Local Centre | 0.03% | 4,223.65㎡ | |
| E4 | General Industrial | 28% | 3,456,846.11㎡ | |
| MU1 | Mixed Use | 1.38% | 170,662.07㎡ | |
| R2 | Environmental Living | 24.24% | 2,992,776.77㎡ | |
| R3 | Medium Density Residential | 5.9% | 728,146.72㎡ | |
| R4 | High Density Residential | 1.39% | 171,371.48㎡ | |
| R5 | Large Lot Residential | 0.21% | 25,674.51㎡ | |
| RE1 | Low Density Residential | 12.79% | 1,578,821.21㎡ | |
| RE2 | Private Recreation | 0.28% | 34,580.36㎡ | |
| RU2 | Rural Landscape | 1.21% | 149,599.75㎡ | |
| SP2 | Infrastructure | 21.56% | 2,660,974.82㎡ |
Looking to research a property in INGLEBURN?
Go to mapData Source - ABS