Currawarna NSW 2650
This Currawarna suburb profile includes demographic data and planning information to help you make an informed property decision.
An average home in Currawarna is owned with a mortgage by couples with children. The average age in Currawarna is 38. Separate houses are common in Currawarna and the area is mostly Primary Production (97.41%), Forestry (1.36%) and Environmental Living (0.84%).
Currawarna demographics
Population
199
Average Age
38
Age Distribution
Employment Type
Median Weekly Income
Traveled to Work
Car
81.4%
Tram
0.0%
Bicycle
0.0%
Train
0.0%
Walking
4.3%
Bus
0.0%
Currawarna property information
Number of Bedrooms
Tenure Type
Property Types in Currawarna
Separate house
Semi detached house
Unit/Apartment
Median monthly mortgage repayments
$1,083
Median weekly rental payments
$250
Average number of bedrooms per dwelling
3.5
Average number of people per household
3
Household Composition
Family Composition
Couple family without children
One parent family
Couple family with children
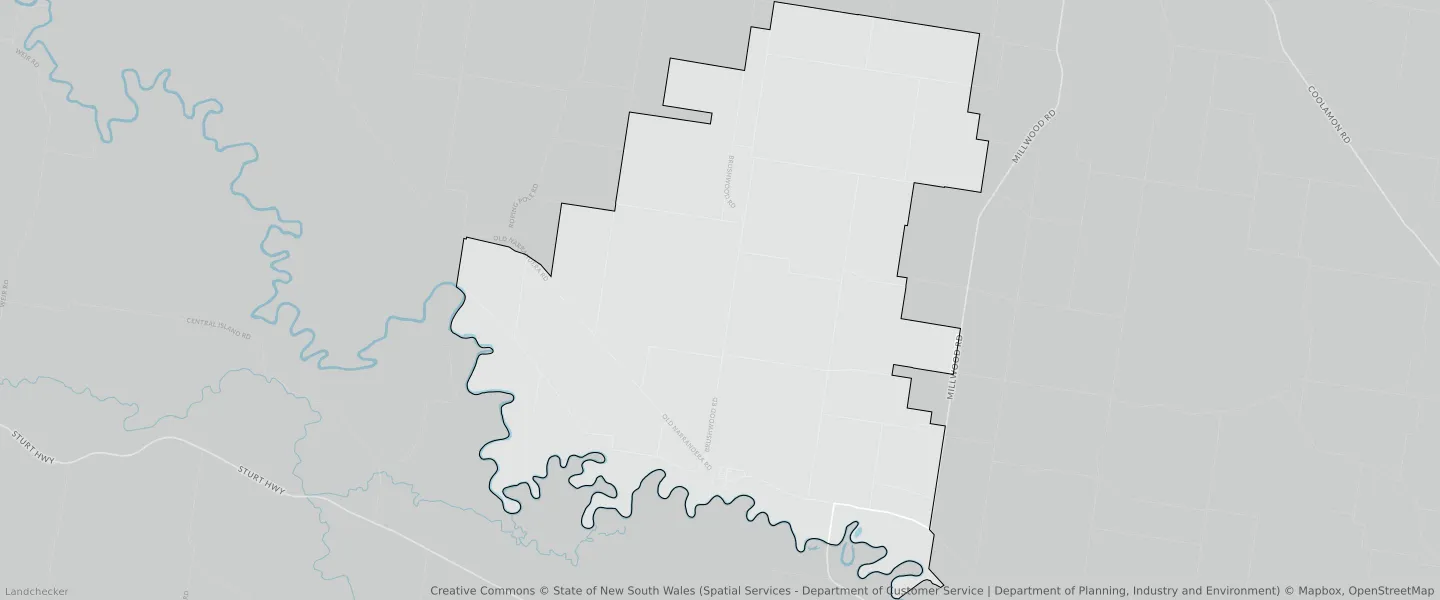
CURRAWARNA planning zones
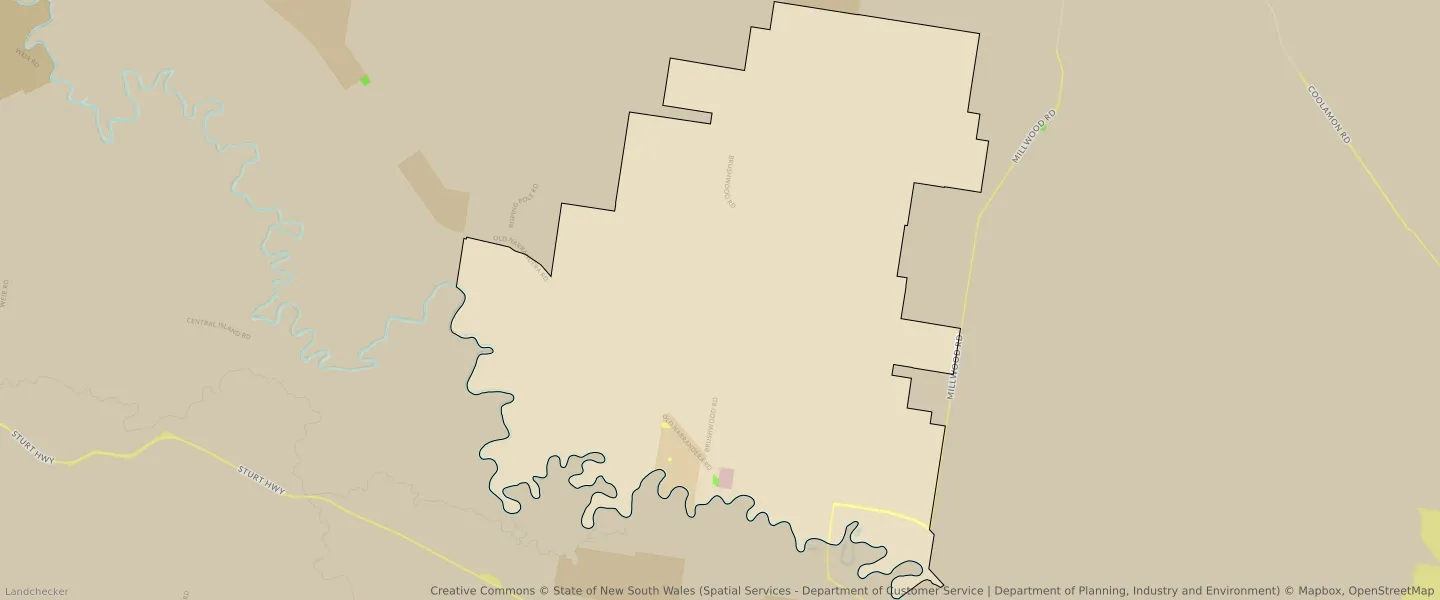
| Zone Code | Zone Name | Percentage Covered | Area Covered | |
|---|---|---|---|---|
| RE1 | Low Density Residential | 0.02% | 45,633.68㎡ | |
| RU1 | Primary Production | 97.41% | 181,544,961.01㎡ | |
| RU3 | Forestry | 1.36% | 2,531,918.89㎡ | |
| RU5 | Village | 0.14% | 264,645.19㎡ | |
| SP2 | Infrastructure | 0.22% | 418,716.82㎡ | |
| W1 | Environmental Living | 0.84% | 1,562,809.14㎡ |
Looking to research a property in CURRAWARNA?
Go to mapData Source - ABS