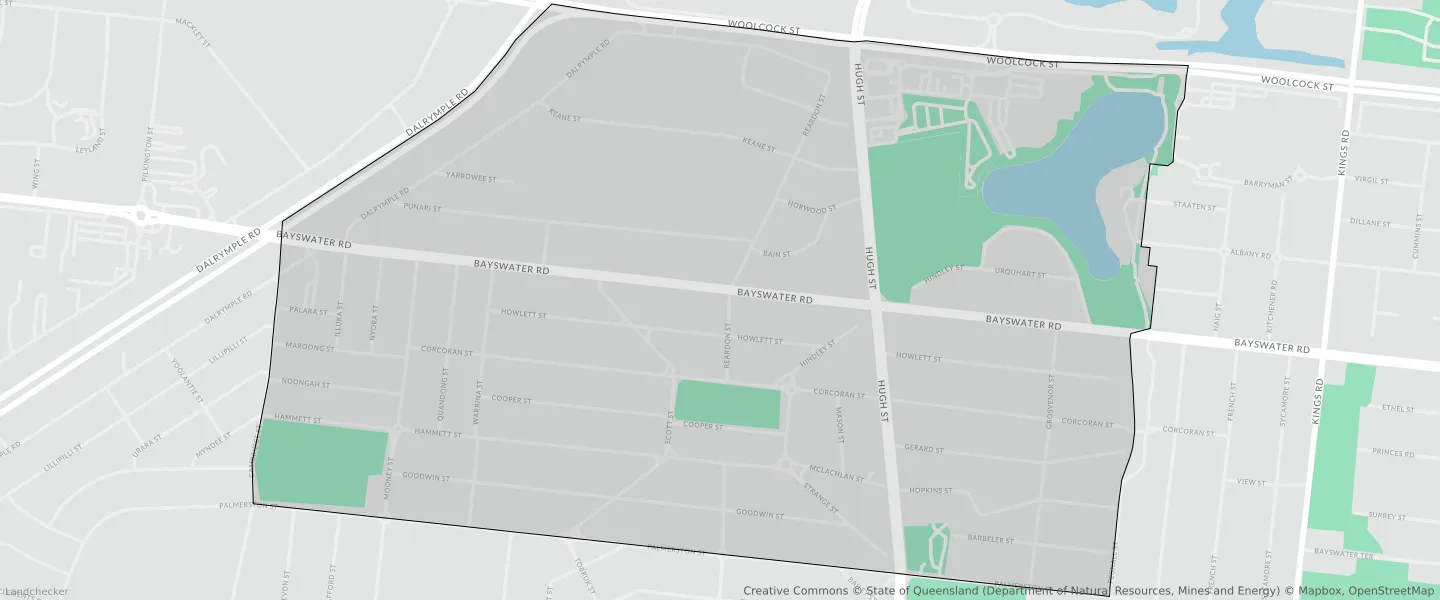
Currajong QLD 4812
This Currajong suburb profile includes demographic data and planning information to help you make an informed property decision.
An average home in Currajong is owned with a mortgage by couples without children. The average age in Currajong is 39. Separate houses are common in Currajong and the area is mostly General Residential (36.25%), Industry (11.79%) and Recreation and Open Space (8.3%).
Currajong demographics
Population
2490
Average Age
39
Age Distribution
Employment Type
Median Weekly Income
Traveled to Work
Car
85.3%
Tram
0.0%
Bicycle
1.0%
Train
0.0%
Walking
2.5%
Bus
1.1%
Currajong property information
Number of Bedrooms
Tenure Type
Property Types in Currajong
Separate house
Semi detached house
Unit/Apartment
Median monthly mortgage repayments
$1,300
Median weekly rental payments
$270
Average number of bedrooms per dwelling
2.9
Average number of people per household
2
Household Composition
Family Composition
Couple family without children
One parent family
Couple family with children
CURRAJONG planning zones

| Zone Code | Zone Name | Percentage Covered | Area Covered | |
|---|---|---|---|---|
| CF | Community Facilities | 1.04% | 22,238.2㎡ | |
| CR | General Residential | 1.63% | 34,871.02㎡ | |
| LDR | General Residential | 36.25% | 775,582.8㎡ | |
| LII | Industry | 11.79% | 252,318.41㎡ | |
| MDR | General Residential | 3.27% | 69,924.71㎡ | |
| MU | Mixed Use | 2.96% | 63,282.02㎡ | |
| NC | Centre | 1.09% | 23,287.12㎡ | |
| OS | Recreation and Open Space | 8.3% | 177,661.28㎡ | |
| SR | Recreation and Open Space | 4.18% | 89,426.51㎡ |
Looking to research a property in CURRAJONG?
Go to mapData Source - ABS