Currabubula NSW 2342
This Currabubula suburb profile includes demographic data and planning information to help you make an informed property decision.
An average home in Currabubula is owned with a mortgage by couples with children. The average age in Currabubula is 41. Separate houses are common in Currabubula and the area is mostly Primary Production (99.19%), Primary Production (0.41%) and Village (0.2%).
Currabubula demographics
Population
339
Average Age
41
Age Distribution
Employment Type
Median Weekly Income
Traveled to Work
Car
83.8%
Tram
0.0%
Bicycle
0.0%
Train
0.0%
Walking
4.0%
Bus
0.0%
Currabubula property information
Number of Bedrooms
Tenure Type
Property Types in Currabubula
Separate house
Semi detached house
Unit/Apartment
Median monthly mortgage repayments
$1,517
Median weekly rental payments
$270
Average number of bedrooms per dwelling
3.5
Average number of people per household
3
Household Composition
Family Composition
Couple family without children
One parent family
Couple family with children
CURRABUBULA planning zones
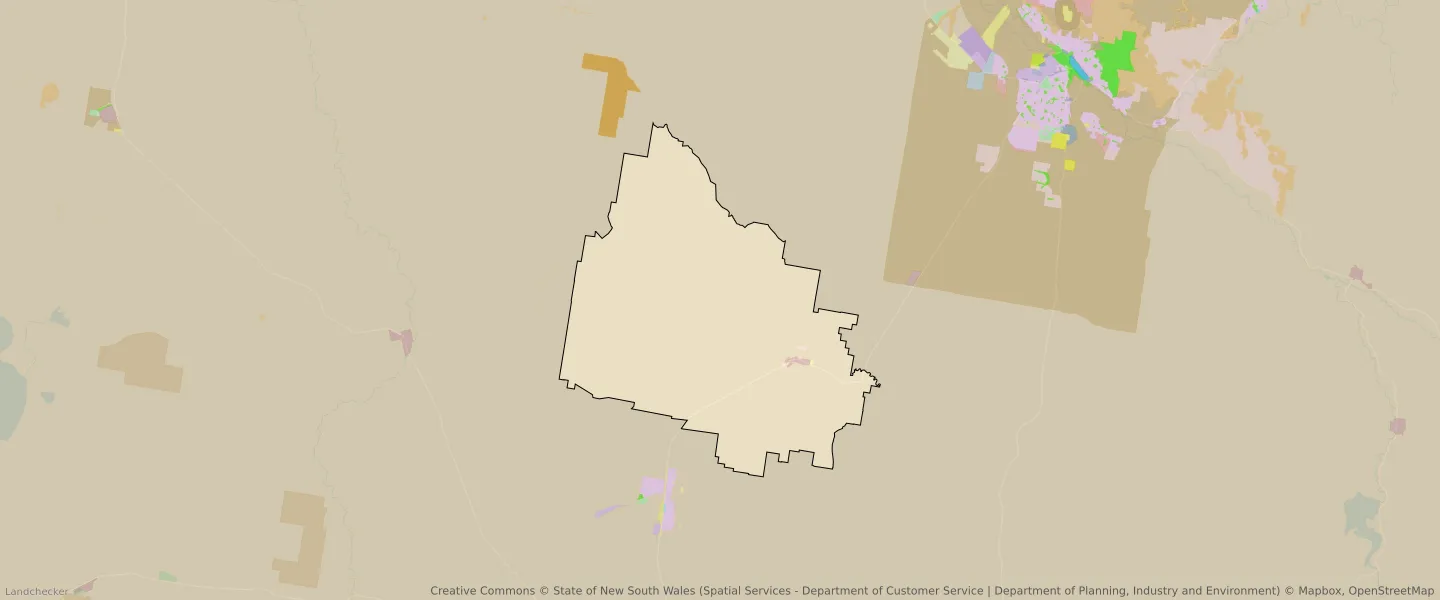
| Zone Code | Zone Name | Percentage Covered | Area Covered | |
|---|---|---|---|---|
| R5 | Large Lot Residential | 0.18% | 463,821.73㎡ | |
| RU1 | Primary Production | 0.41% | 1,091,963.61㎡ | |
| RU1 | Primary Production | 99.19% | 262,108,469.24㎡ | |
| RU1 | Primary Production | 0% | 365.96㎡ | |
| RU5 | Village | 0.2% | 541,258.16㎡ | |
| SP1 | Infrastructure | 0.02% | 40,589.13㎡ |
Looking to research a property in CURRABUBULA?
Go to mapData Source - ABS