Cromer NSW 2099
This Cromer suburb profile includes demographic data and planning information to help you make an informed property decision.
An average home in Cromer is owned with a mortgage by couples with children. The average age in Cromer is 41. Separate houses are common in Cromer and the area is mostly Environmental Living (31.2%), Deferred Matter (25.61%) and Infrastructure (14.09%).
Cromer demographics
Population
8030
Average Age
41
Age Distribution
Employment Type
Median Weekly Income
Traveled to Work
Car
84.1%
Tram
0.0%
Bicycle
0.7%
Train
0.0%
Walking
2.0%
Bus
3.4%
Cromer property information
Number of Bedrooms
Tenure Type
Property Types in Cromer
Separate house
Semi detached house
Unit/Apartment
Median monthly mortgage repayments
$3,142
Median weekly rental payments
$650
Average number of bedrooms per dwelling
3.4
Average number of people per household
3
Household Composition
Family Composition
Couple family without children
One parent family
Couple family with children
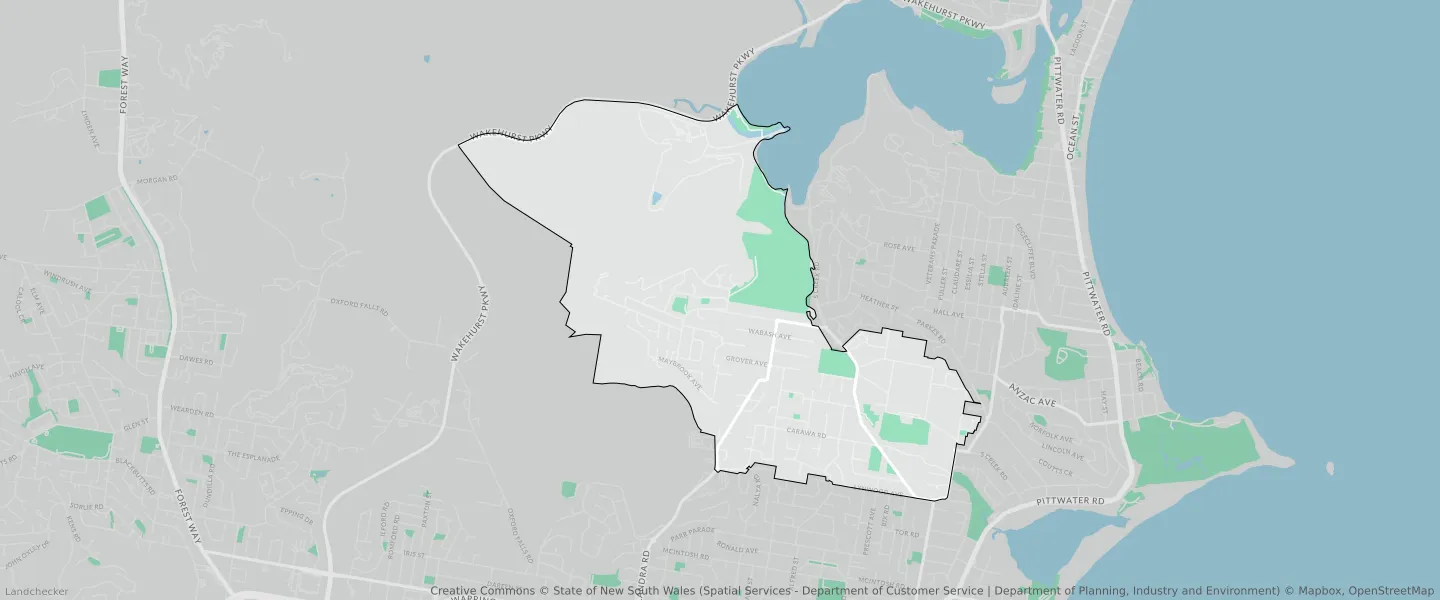
CROMER planning zones
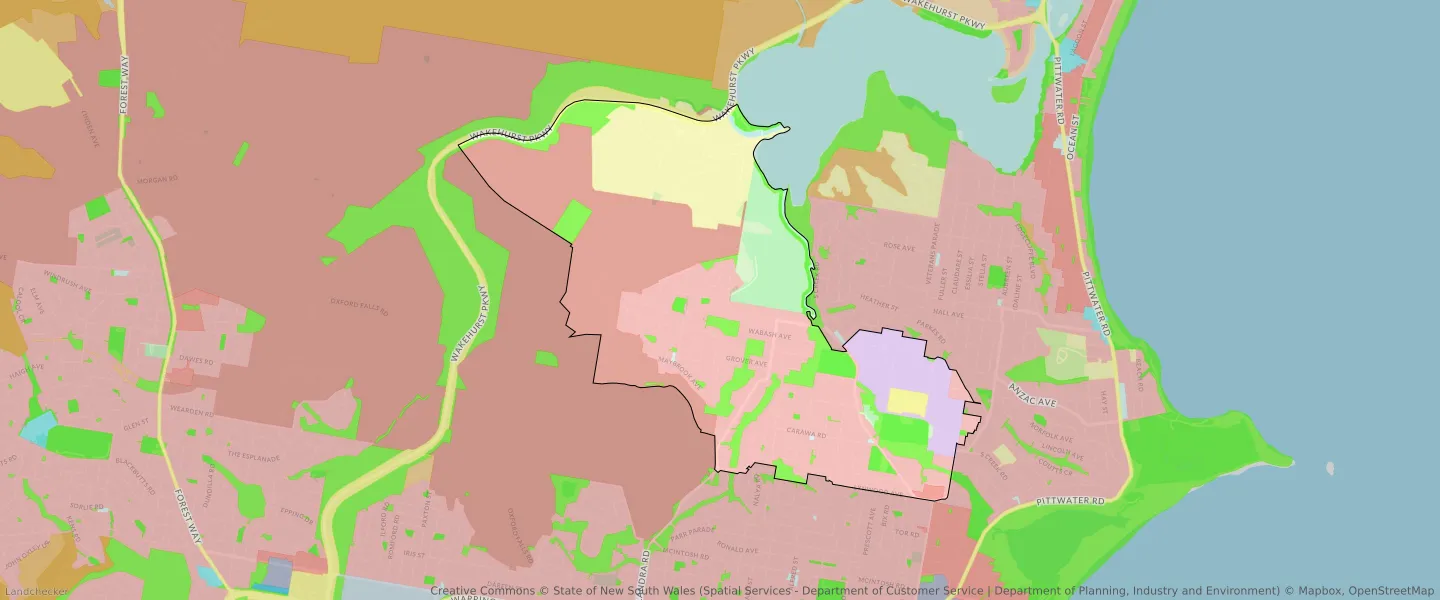
| Zone Code | Zone Name | Percentage Covered | Area Covered | |
|---|---|---|---|---|
| DM | Deferred Matter | 25.61% | 1,618,064.97㎡ | |
| E1 | Local Centre | 0.08% | 5,041.68㎡ | |
| E4 | General Industrial | 7.26% | 458,944.36㎡ | |
| R2 | Environmental Living | 31.2% | 1,971,511.69㎡ | |
| R3 | Medium Density Residential | 0.3% | 18,736.21㎡ | |
| RE1 | Low Density Residential | 12.07% | 762,460.22㎡ | |
| RE2 | Private Recreation | 6.85% | 433,011.35㎡ | |
| SP1 | Infrastructure | 14.09% | 890,219.78㎡ | |
| SP2 | Infrastructure | 1.86% | 117,555.43㎡ | |
| W1 | Environmental Living | 0.68% | 43,108.83㎡ |
Looking to research a property in CROMER?
Go to mapData Source - ABS