Cranbourne VIC 3977
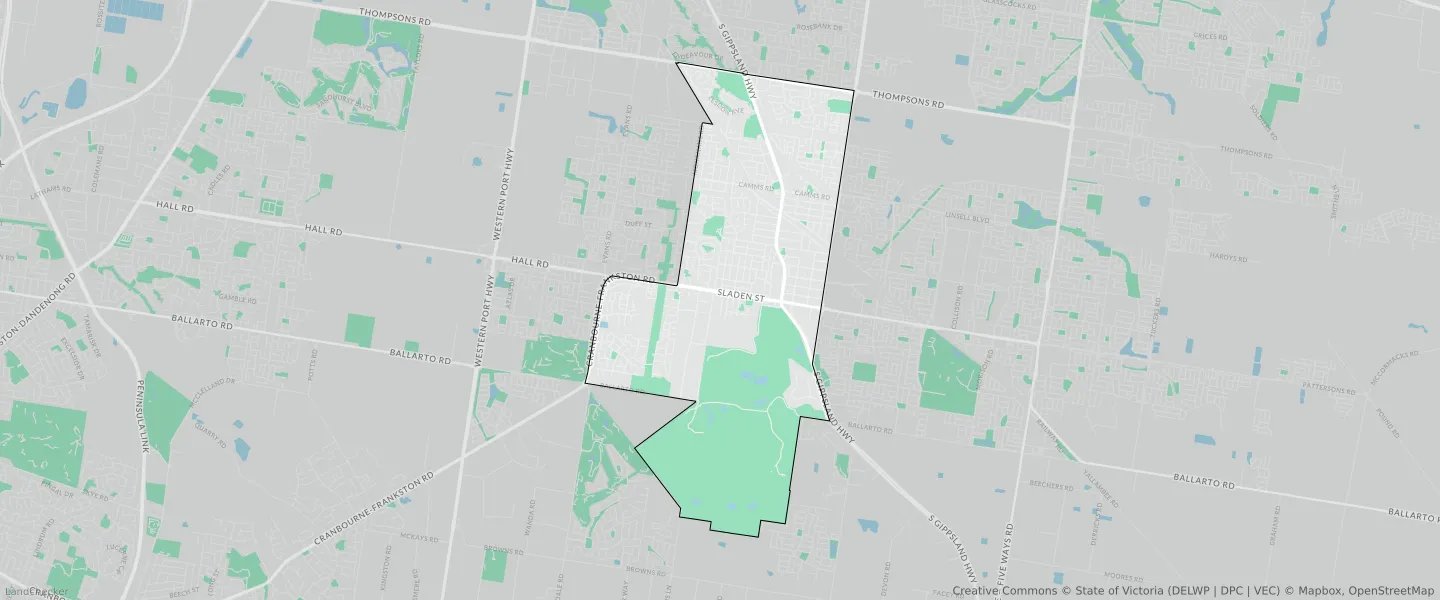
This Cranbourne suburb profile includes demographic data and planning information to help you make an informed property decision.
An average home in Cranbourne is owned with a mortgage by couples with children. The average age in Cranbourne is 35. Separate houses are common in Cranbourne and the area is mostly GENERAL RESIDENTIAL ZONE (39.7%), PUBLIC CONSERVATION AND RESOURCE ZONE (22.08%) and SPECIAL USE ZONE (11.97%).
Cranbourne demographics
Population
21281
Average Age
35
Age Distribution
Employment Type
Median Weekly Income
Traveled to Work
Car
85.7%
Tram
0.0%
Bicycle
0.2%
Train
2.2%
Walking
1.3%
Bus
1.0%
Cranbourne property information
Number of Bedrooms
Tenure Type
Property Types in Cranbourne
Separate house
Semi detached house
Unit/Apartment
Median monthly mortgage repayments
$1,627
Median weekly rental payments
$342
Average number of bedrooms per dwelling
3.2
Average number of people per household
3
Household Composition
Family Composition
Couple family without children
One parent family
Couple family with children
CRANBOURNE planning zones
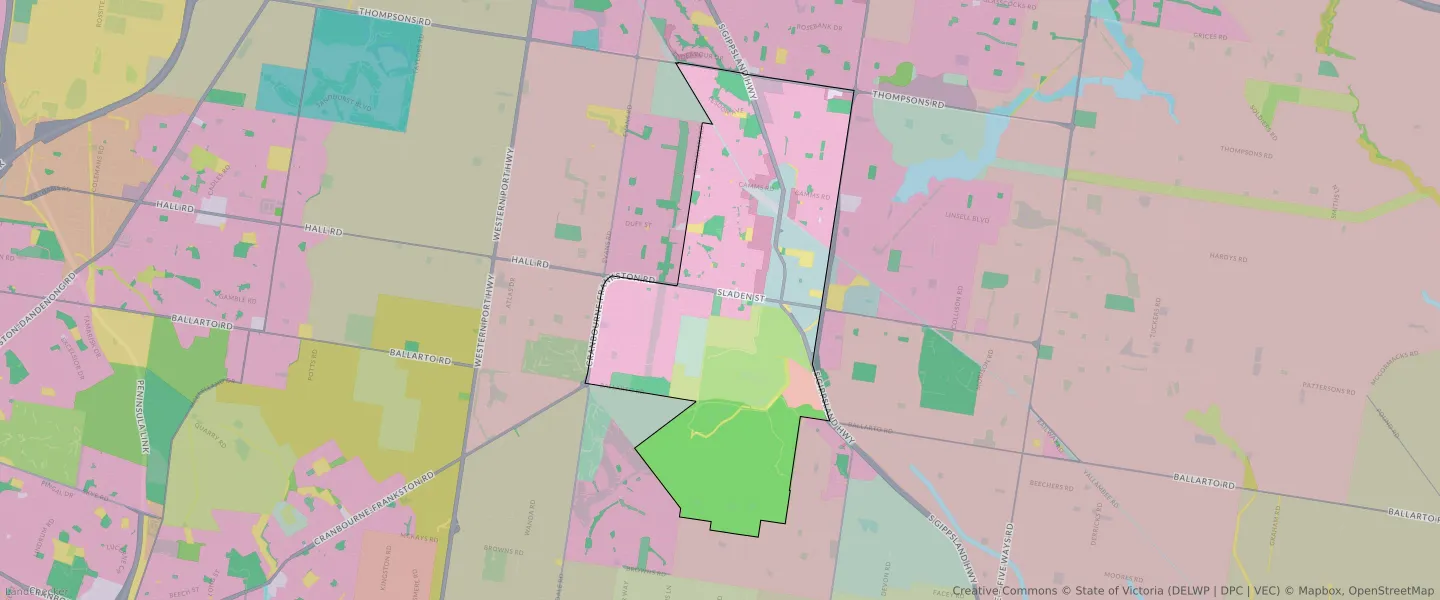
| Zone Code | Zone Name | Percentage Covered | Area Covered | |
|---|---|---|---|---|
| ACZ | ACTIVITY CENTRE ZONE | 7.19% | 1,186,883.17㎡ | |
| C1Z | COMMERCIAL 1 ZONE | 0.23% | 37,662.7㎡ | |
| C2Z | COMMERCIAL 2 ZONE | 1% | 165,361.76㎡ | |
| FZ | FARMING ZONE | 2.13% | 350,994.9㎡ | |
| GRZ | GENERAL RESIDENTIAL ZONE | 39.7% | 6,555,108.76㎡ | |
| LDRZ | LOW DENSITY RESIDENTIAL ZONE | 1.74% | 286,414.39㎡ | |
| PCRZ | PUBLIC CONSERVATION AND RESOURCE ZONE | 22.08% | 3,644,970.17㎡ | |
| PPRZ | PUBLIC PARK AND RECREATION ZONE | 4.86% | 802,446.24㎡ | |
| PUZ | PUBLIC USE ZONE | 1.81% | 298,382.03㎡ | |
| RGZ | RESIDENTIAL GROWTH ZONE | 2.71% | 447,133.62㎡ | |
| SUZ | SPECIAL USE ZONE | 11.97% | 1,976,100.31㎡ | |
| TRZ1 | TRANSPORT ZONE | 1.02% | 168,730.94㎡ | |
| TRZ2 | TRANSPORT ZONE | 3.57% | 588,824.71㎡ | |
| UGZ | URBAN GROWTH ZONE | 0.01% | 1,400.42㎡ |
Looking to research a property in CRANBOURNE?
Go to mapData Source - ABS