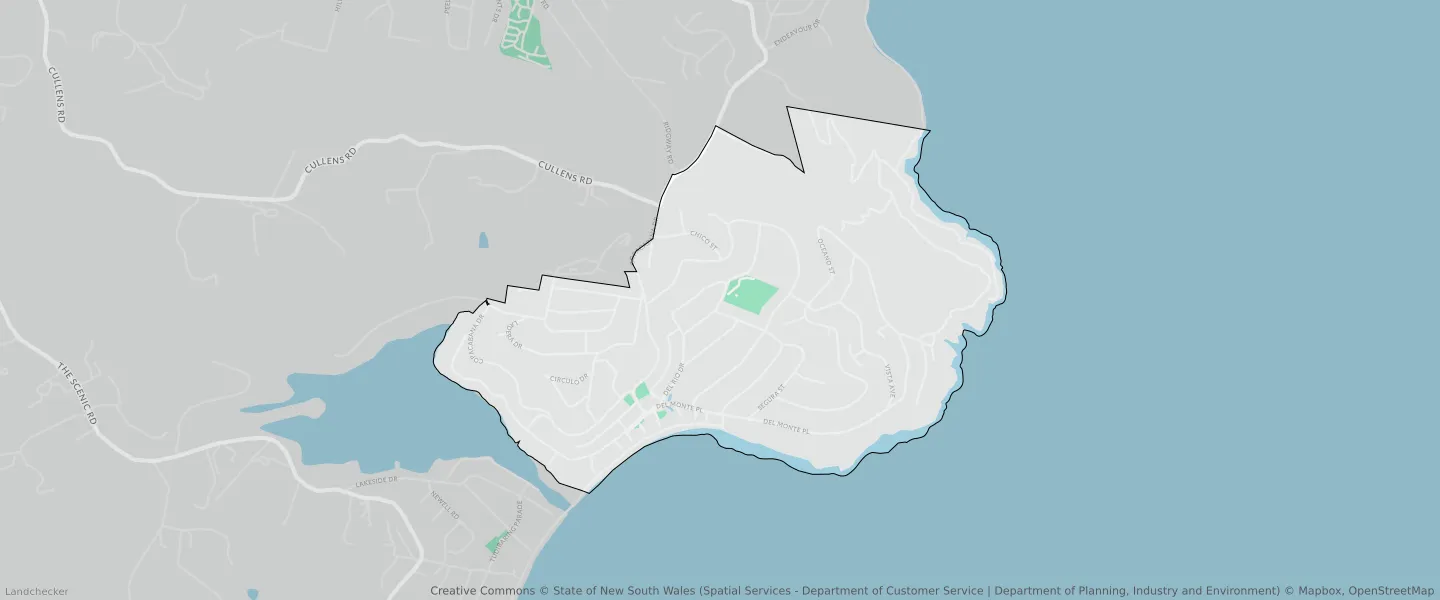
Copacabana NSW 2251
This Copacabana suburb profile includes demographic data and planning information to help you make an informed property decision.
An average home in Copacabana is owned with a mortgage by couples with children. The average age in Copacabana is 43. Separate houses are common in Copacabana and the area is mostly Environmental Living (58.75%), Environmental Conservation (17.65%) and Low Density Residential (14.93%).
Copacabana demographics
Population
2809
Average Age
43
Age Distribution
Employment Type
Median Weekly Income
Traveled to Work
Car
88.3%
Tram
0.0%
Bicycle
0.0%
Train
1.1%
Walking
1.4%
Bus
0.8%
Copacabana property information
Number of Bedrooms
Tenure Type
Property Types in Copacabana
Separate house
Semi detached house
Unit/Apartment
Median monthly mortgage repayments
$2,300
Median weekly rental payments
$510
Average number of bedrooms per dwelling
3.6
Average number of people per household
3
Household Composition
Family Composition
Couple family without children
One parent family
Couple family with children
COPACABANA planning zones
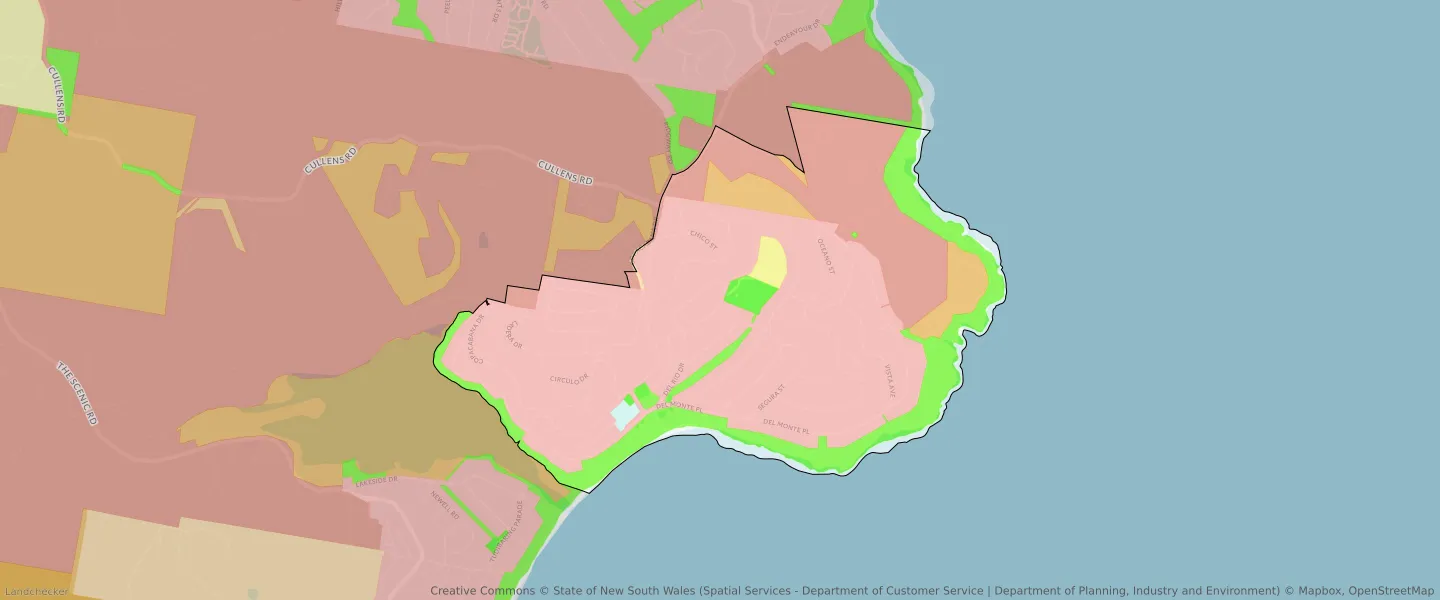
| Zone Code | Zone Name | Percentage Covered | Area Covered | |
|---|---|---|---|---|
| C2 | Environmental Conservation | 17.65% | 363,538.95㎡ | |
| C3 | Environmental Conservation | 3.95% | 81,428.8㎡ | |
| C4 | Environmental Living | 0.24% | 4,958.5㎡ | |
| E1 | Local Centre | 0.38% | 7,873.07㎡ | |
| R2 | Environmental Living | 58.75% | 1,209,834.69㎡ | |
| RE1 | Low Density Residential | 14.93% | 307,463.75㎡ | |
| SP2 | Infrastructure | 0.98% | 20,151.89㎡ | |
| UL | Unzoned Land | 3.12% | 64,170.16㎡ |
Looking to research a property in COPACABANA?
Go to mapData Source - ABS