Coolbinia WA 6050
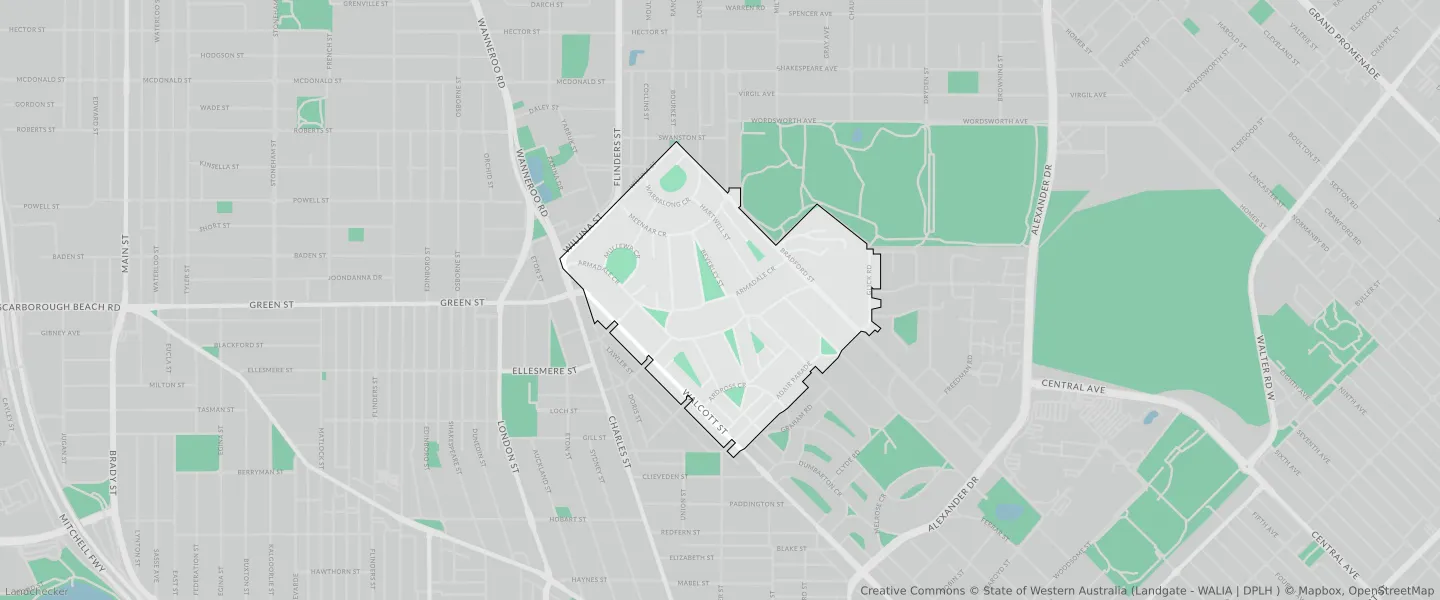
This Coolbinia suburb profile includes demographic data and planning information to help you make an informed property decision.
An average home in Coolbinia is owned with a mortgage by couples with children. The average age in Coolbinia is 40. Separate houses are common in Coolbinia and the area is mostly URBAN ZONE (97.66%), URBAN (97.66%) and R10 (79.02%).
Coolbinia demographics
Population
1751
Average Age
40
Age Distribution
Employment Type
Median Weekly Income
Traveled to Work
Car
79.7%
Tram
0.0%
Bicycle
1.9%
Train
0.0%
Walking
1.4%
Bus
9.5%
Coolbinia property information
Number of Bedrooms
Tenure Type
Property Types in Coolbinia
Separate house
Semi detached house
Unit/Apartment
Median monthly mortgage repayments
$2,600
Median weekly rental payments
$350
Average number of bedrooms per dwelling
3.6
Average number of people per household
3
Household Composition
Family Composition
Couple family without children
One parent family
Couple family with children
COOLBINIA planning zones
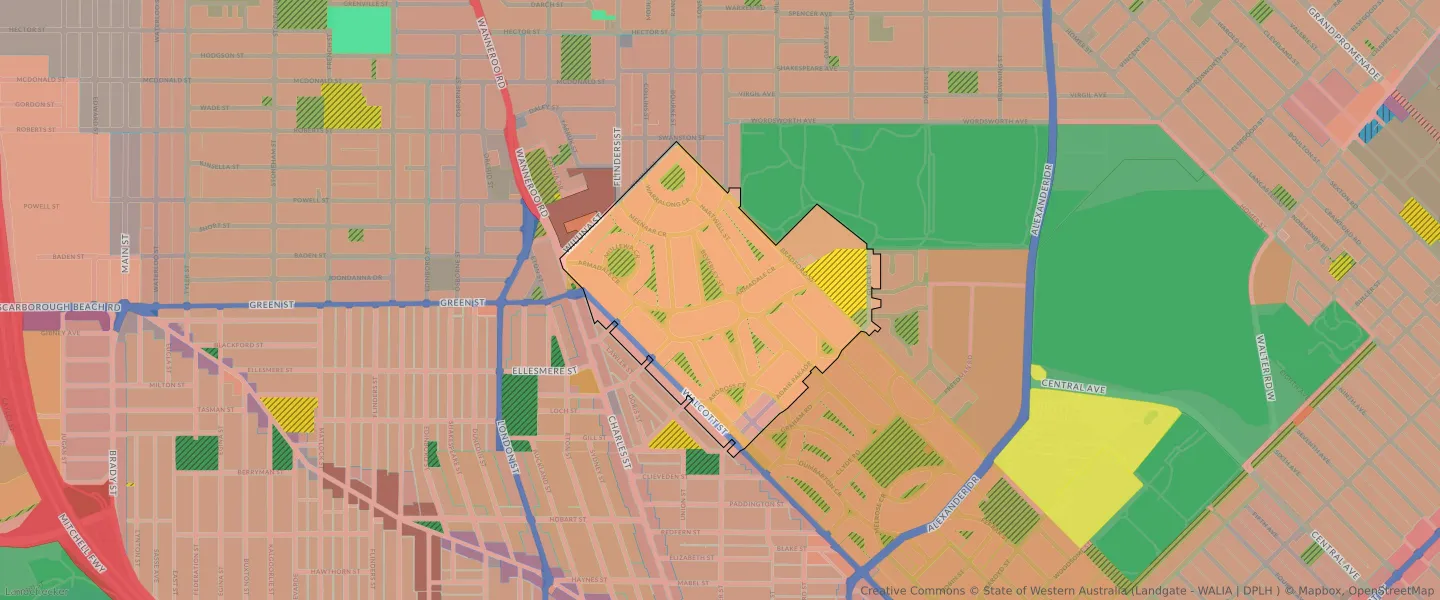
| Zone Code | Zone Name | Percentage Covered | Area Covered | |
|---|---|---|---|---|
| LOCAL CENTRE | LOCAL CENTRE | 0.83% | 7,308.53㎡ | |
| LOCAL CENTRE | LOCAL CENTRE | 0.15% | 1,337.51㎡ | |
| NO ZONE | NO ZONE | 0% | 15㎡ | |
| OTHER REGIONAL ROADS | OTHER REGIONAL ROADS RESERVE | 2.34% | 20,735.72㎡ | |
| PRIVATE INSTITUTION | PRIVATE INSTITUTION | 4.8% | 42,469.15㎡ | |
| PUBLIC OPEN SPACE AND LOCAL AUTHORITY PURPOSES | PUBLIC OPEN SPACE AND LOCAL AUTHORITY PURPOSES | 6.39% | 56,539.06㎡ | |
| PUBLIC USE | PUBLIC USE | 5.16% | 45,654.08㎡ | |
| R10 | R10 | 79.02% | 699,230.33㎡ | |
| R20 | R20 | 1.99% | 17,568.15㎡ | |
| R40 | R40 | 0.6% | 5,274.97㎡ | |
| R60 | R60 | 5.1% | 45,090.32㎡ | |
| RESIDENTIAL | RESIDENTIAL | 3% | 26,567.32㎡ | |
| RESIDENTIAL | RESIDENTIAL | 55.01% | 486,793.28㎡ | |
| URBAN | URBAN | 97.66% | 864,193.69㎡ | |
| URBAN | URBAN ZONE | 97.66% | 864,193.69㎡ |
Looking to research a property in COOLBINIA?
Go to mapData Source - ABS