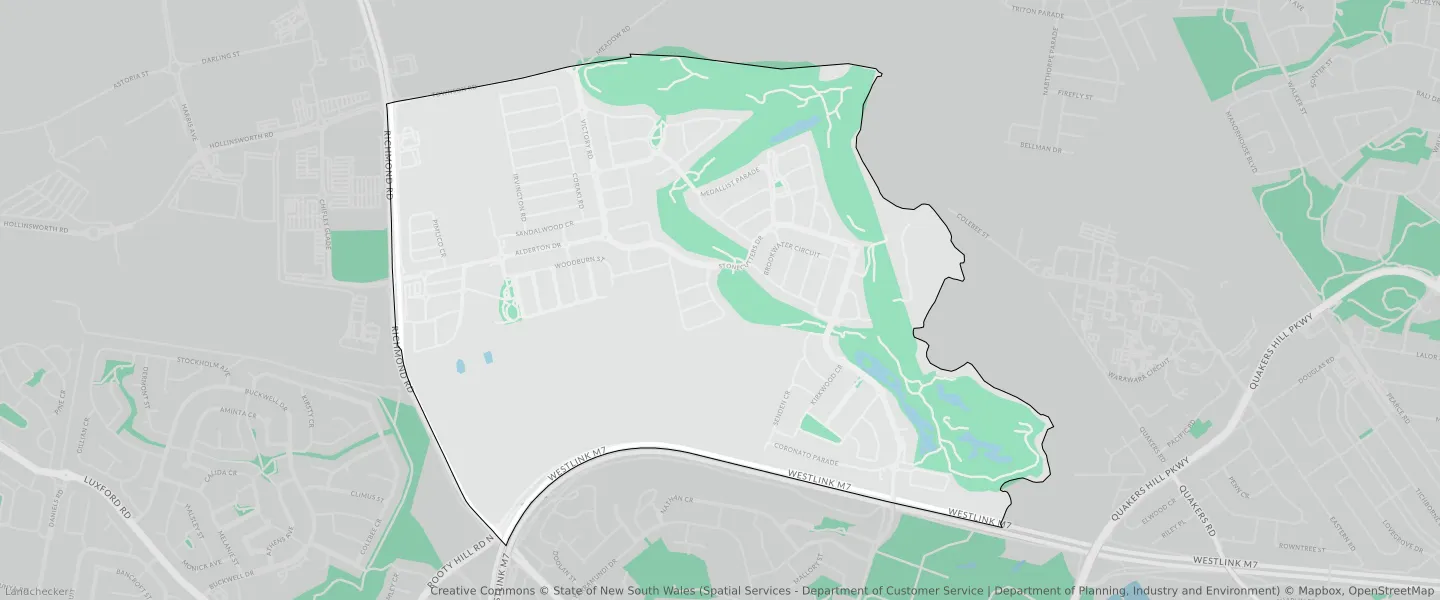
Colebee NSW 2761
This Colebee suburb profile includes demographic data and planning information to help you make an informed property decision.
An average home in Colebee is owned with a mortgage by couples with children. The average age in Colebee is 33. Separate houses are common in Colebee and the area is mostly Medium Density Residential (26.26%), Environmental Conservation (22.42%) and Private Recreation (21.91%).
Colebee demographics
Population
4914
Average Age
33
Age Distribution
Employment Type
Median Weekly Income
Traveled to Work
Car
86.1%
Tram
0.0%
Bicycle
0.0%
Train
2.2%
Walking
0.7%
Bus
0.3%
Colebee property information
Number of Bedrooms
Tenure Type
Property Types in Colebee
Separate house
Semi detached house
Unit/Apartment
Median monthly mortgage repayments
$3,000
Median weekly rental payments
$620
Average number of bedrooms per dwelling
4.2
Average number of people per household
4
Household Composition
Family Composition
Couple family without children
One parent family
Couple family with children
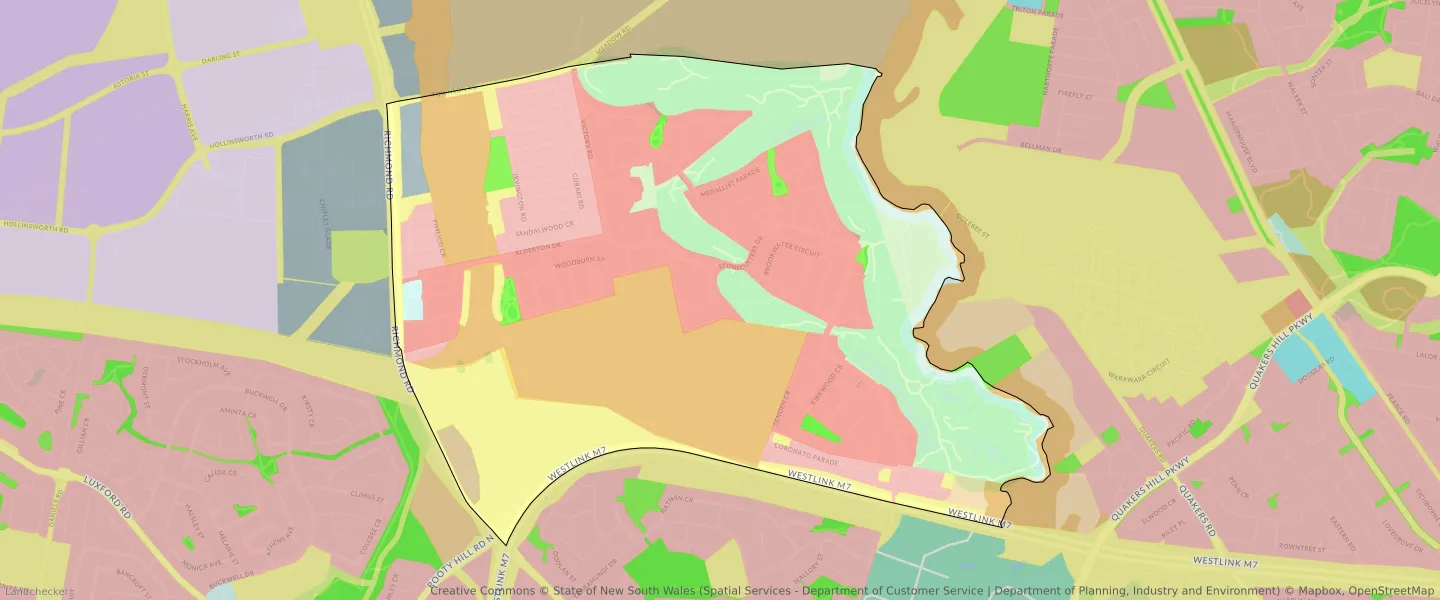
COLEBEE planning zones
| Zone Code | Zone Name | Percentage Covered | Area Covered | |
|---|---|---|---|---|
| B5 | Business Development | 0.89% | 31,216.69㎡ | |
| C2 | Environmental Conservation | 22.42% | 789,900.69㎡ | |
| C4 | Environmental Living | 0.45% | 15,930.37㎡ | |
| E1 | Local Centre | 0.35% | 12,327.22㎡ | |
| R2 | Environmental Living | 9.53% | 335,740.93㎡ | |
| R3 | Medium Density Residential | 26.26% | 925,100.13㎡ | |
| RE1 | Low Density Residential | 1.52% | 53,649.4㎡ | |
| RE2 | Private Recreation | 21.91% | 771,901.16㎡ | |
| RU4 | Primary Production Small Lots | 0.77% | 27,187.44㎡ | |
| SP2 | Infrastructure | 13.16% | 463,724.19㎡ | |
| W1 | Environmental Living | 2.85% | 100,392㎡ |
Looking to research a property in COLEBEE?
Go to mapData Source - ABS