Cherwell QLD 4660
This Cherwell suburb profile includes demographic data and planning information to help you make an informed property decision.
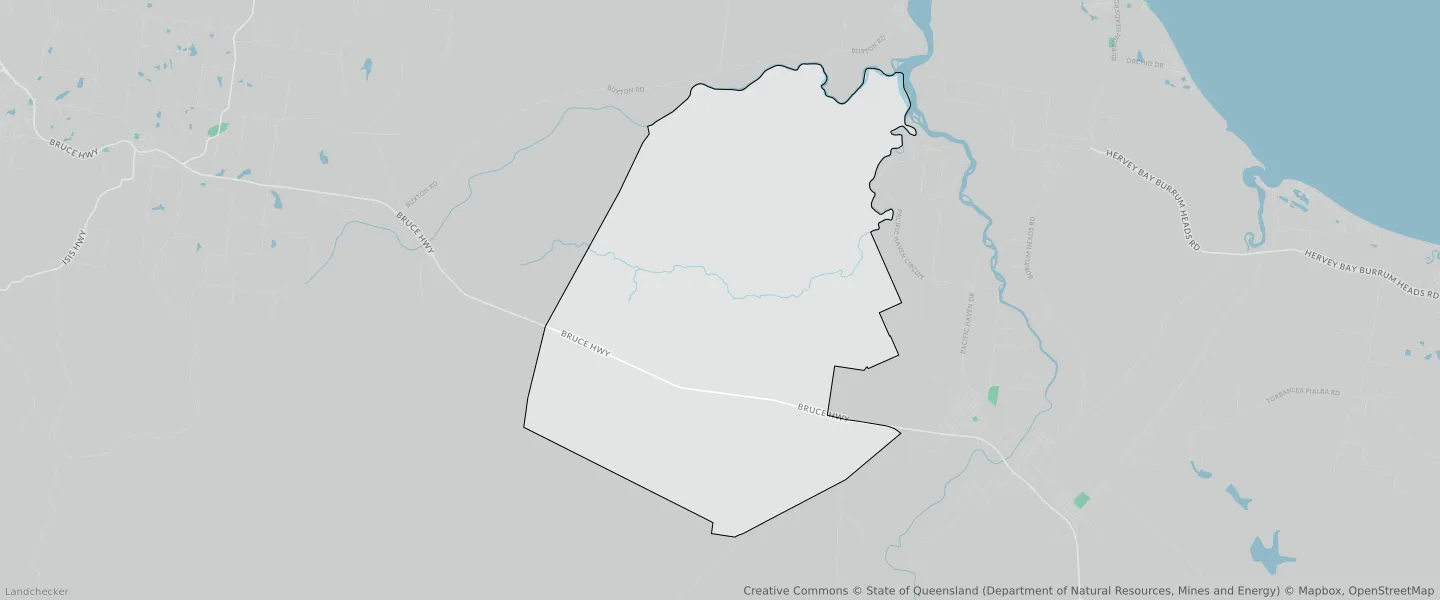
An average home in Cherwell is other/not stated by couples with children. The average age in Cherwell is 39. Separate houses are common in Cherwell and the area is mostly Rural (98.68%), Community Facilities 1 (0.87%) and Rural Residential (0.01%).
Cherwell demographics
Population
10
Average Age
39
Age Distribution
Employment Type
Median Weekly Income
Traveled to Work
Car
100.0%
Tram
0.0%
Bicycle
0.0%
Train
0.0%
Walking
0.0%
Bus
0.0%
Cherwell property information
Number of Bedrooms
Tenure Type
Property Types in Cherwell
Separate house
Semi detached house
Unit/Apartment
Median monthly mortgage repayments
$405
Median weekly rental payments
$0
Average number of bedrooms per dwelling
0.0
Average number of people per household
6
Household Composition
Family Composition
Couple family without children
One parent family
Couple family with children
CHERWELL planning zones

| Zone Code | Zone Name | Percentage Covered | Area Covered | |
|---|---|---|---|---|
| COMMUNITY FACILITIES | Community Facilities 1 | 0.87% | 1,267,815.81㎡ | |
| ENVIRONMENTAL MANAGEMENT AND CONSERVATION | Environmental Management and Conservation | 0.01% | 11,874.19㎡ | |
| OPEN SPACE | Open Space | 0% | 614.55㎡ | |
| RURAL | Rural | 98.68% | 143,627,103.33㎡ | |
| RURAL RESIDENTIAL | Rural Residential | 0.01% | 9,669.46㎡ |
Looking to research a property in CHERWELL?
Go to mapData Source - ABS