Carwoola NSW 2620
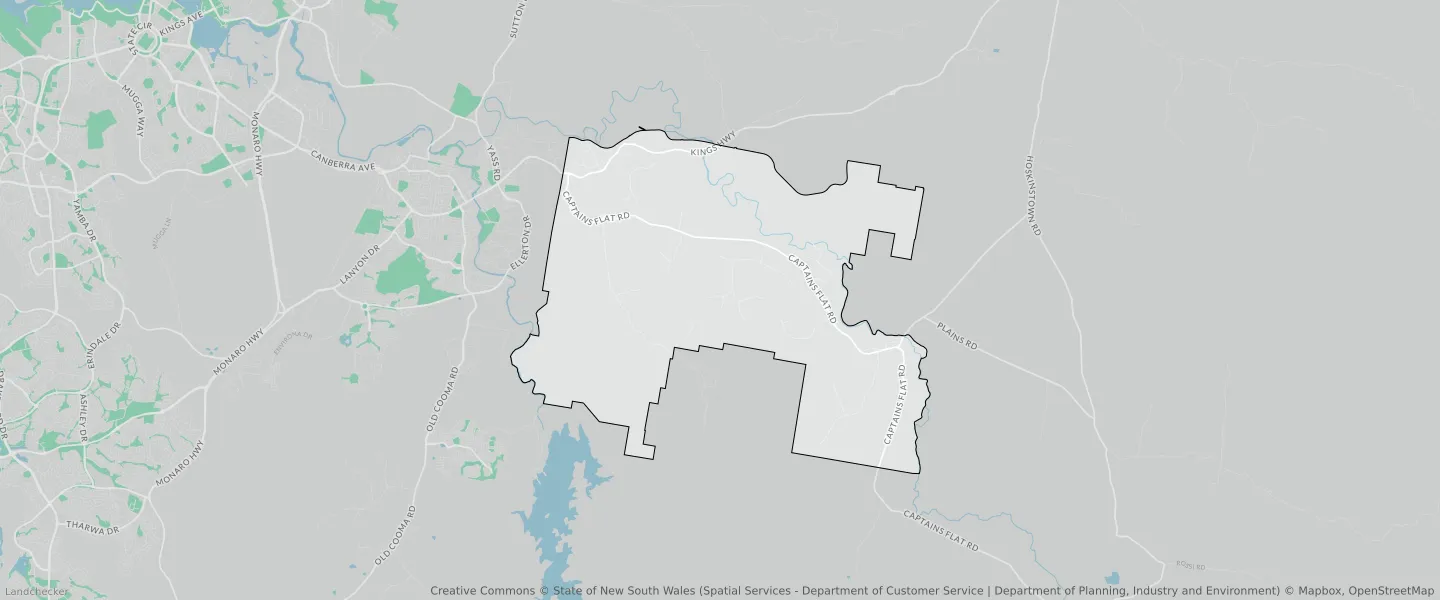
This Carwoola suburb profile includes demographic data and planning information to help you make an informed property decision.
An average home in Carwoola is owned with a mortgage by couples with children. The average age in Carwoola is 44. Separate houses are common in Carwoola and the area is mostly Environmental Living (49.19%), Primary Production (16.09%) and Environmental Conservation (11.29%).
Carwoola demographics
Population
1602
Average Age
44
Age Distribution
Employment Type
Median Weekly Income
Traveled to Work
Car
90.2%
Tram
0.0%
Bicycle
0.0%
Train
0.0%
Walking
1.2%
Bus
0.0%
Carwoola property information
Number of Bedrooms
Tenure Type
Property Types in Carwoola
Separate house
Semi detached house
Unit/Apartment
Median monthly mortgage repayments
$2,839
Median weekly rental payments
$450
Average number of bedrooms per dwelling
3.9
Average number of people per household
3
Household Composition
Family Composition
Couple family without children
One parent family
Couple family with children
CARWOOLA planning zones
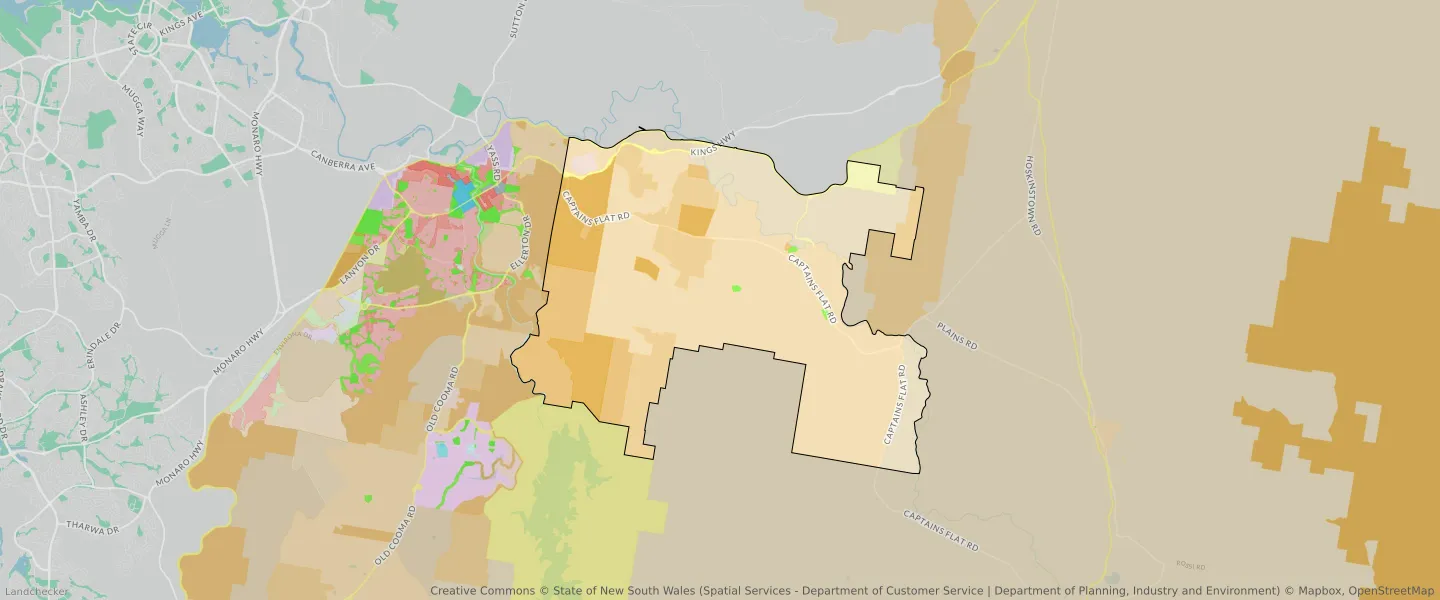
| Zone Code | Zone Name | Percentage Covered | Area Covered | |
|---|---|---|---|---|
| C1 | National Parks and Nature Reserves | 9.91% | 8,474,863.96㎡ | |
| C2 | Environmental Conservation | 9.55% | 8,169,386.79㎡ | |
| C3 | Environmental Conservation | 11.29% | 9,653,834.55㎡ | |
| C4 | Environmental Living | 49.19% | 42,071,764.56㎡ | |
| R5 | Large Lot Residential | 0.49% | 421,787.94㎡ | |
| RE1 | Low Density Residential | 0.14% | 120,330.01㎡ | |
| RU1 | Primary Production | 16.09% | 13,764,442.7㎡ | |
| RU2 | Rural Landscape | 0.93% | 797,654.21㎡ | |
| SP1 | Infrastructure | 1.25% | 1,071,386.85㎡ | |
| SP2 | Infrastructure | 1.09% | 929,915.14㎡ | |
| W1 | Environmental Living | 0.05% | 46,934.35㎡ |
Looking to research a property in CARWOOLA?
Go to mapData Source - ABS