Carlingford NSW 2118
This Carlingford suburb profile includes demographic data and planning information to help you make an informed property decision.
An average home in Carlingford is owned with a mortgage by couples with children. The average age in Carlingford is 38. Separate houses are common in Carlingford and the area is mostly Environmental Living (71.8%), High Density Residential (5.73%) and Low Density Residential (5.58%).
Carlingford demographics
Population
28044
Average Age
38
Age Distribution
Employment Type
Median Weekly Income
Traveled to Work
Car
83.4%
Tram
0.0%
Bicycle
0.1%
Train
1.9%
Walking
2.6%
Bus
3.4%
Carlingford property information
Number of Bedrooms
Tenure Type
Property Types in Carlingford
Separate house
Semi detached house
Unit/Apartment
Median monthly mortgage repayments
$2,500
Median weekly rental payments
$500
Average number of bedrooms per dwelling
3.2
Average number of people per household
3
Household Composition
Family Composition
Couple family without children
One parent family
Couple family with children
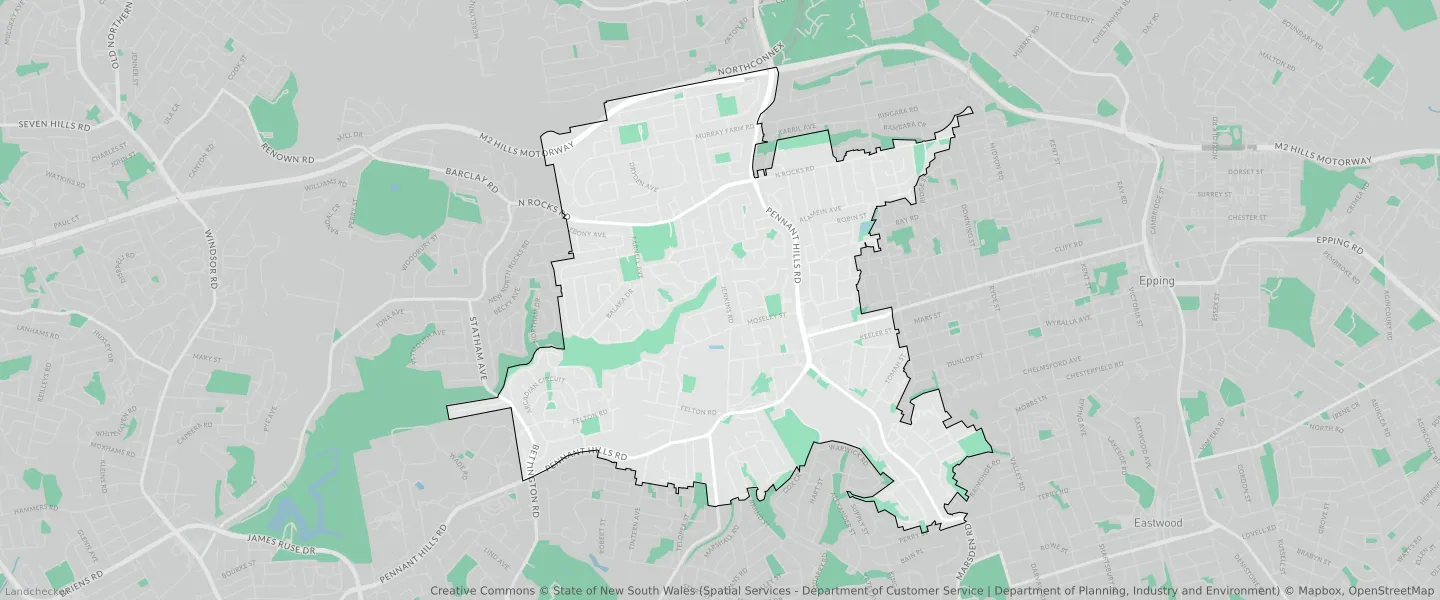
CARLINGFORD planning zones
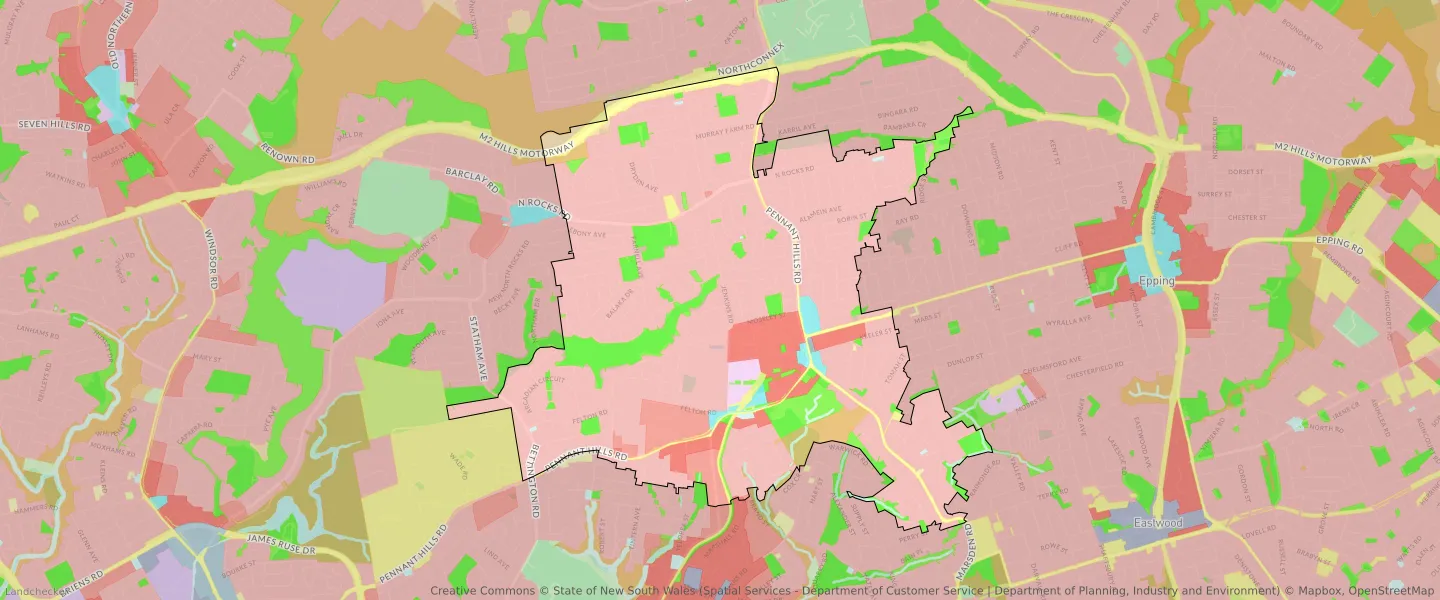
| Zone Code | Zone Name | Percentage Covered | Area Covered | |
|---|---|---|---|---|
| C2 | Environmental Conservation | 5.46% | 465,728.03㎡ | |
| C2 | Environmental Conservation | 0.03% | 2,419.92㎡ | |
| E1 | Local Centre | 1.22% | 103,671.84㎡ | |
| E3 | Business Development | 0.05% | 4,657.17㎡ | |
| R2 | Environmental Living | 71.8% | 6,123,309.74㎡ | |
| R3 | Medium Density Residential | 2.98% | 253,791.71㎡ | |
| R4 | High Density Residential | 5.73% | 488,535.88㎡ | |
| RE1 | Low Density Residential | 5.58% | 475,722.22㎡ | |
| RU3 | Forestry | 0.37% | 31,153.09㎡ | |
| SP1 | Infrastructure | 0.04% | 3,098.76㎡ | |
| SP2 | Infrastructure | 5.17% | 440,532.36㎡ | |
| SP2 | Infrastructure | 0.43% | 36,655.5㎡ | |
| W1 | Environmental Living | 1.16% | 98,926.9㎡ |
Looking to research a property in CARLINGFORD?
Go to mapData Source - ABS