Cardiff NSW 2285
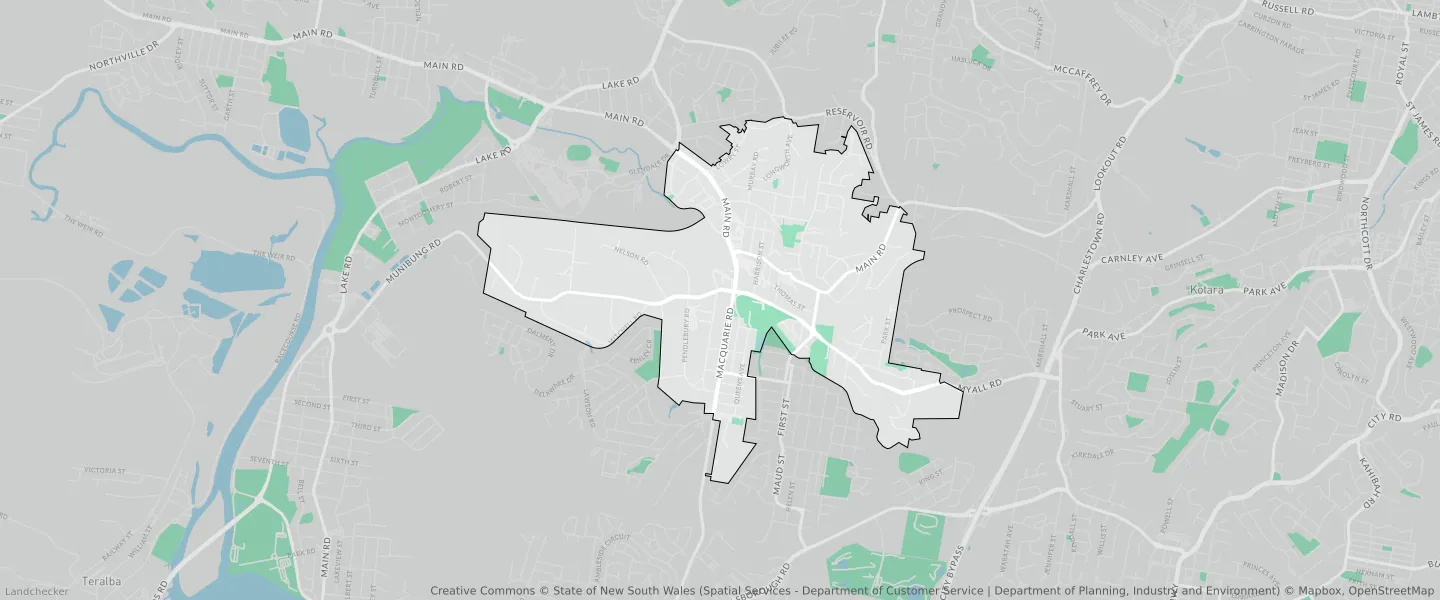
This Cardiff suburb profile includes demographic data and planning information to help you make an informed property decision.
An average home in Cardiff is owned with a mortgage by couples with children. The average age in Cardiff is 38. Separate houses are common in Cardiff and the area is mostly Environmental Living (29.7%), General Industrial (26.72%) and Medium Density Residential (17.41%).
Cardiff demographics
Population
6318
Average Age
38
Age Distribution
Employment Type
Median Weekly Income
Traveled to Work
Car
88.9%
Tram
0.0%
Bicycle
0.2%
Train
0.6%
Walking
1.5%
Bus
1.4%
Cardiff property information
Number of Bedrooms
Tenure Type
Property Types in Cardiff
Separate house
Semi detached house
Unit/Apartment
Median monthly mortgage repayments
$1,733
Median weekly rental payments
$375
Average number of bedrooms per dwelling
2.9
Average number of people per household
2
Household Composition
Family Composition
Couple family without children
One parent family
Couple family with children
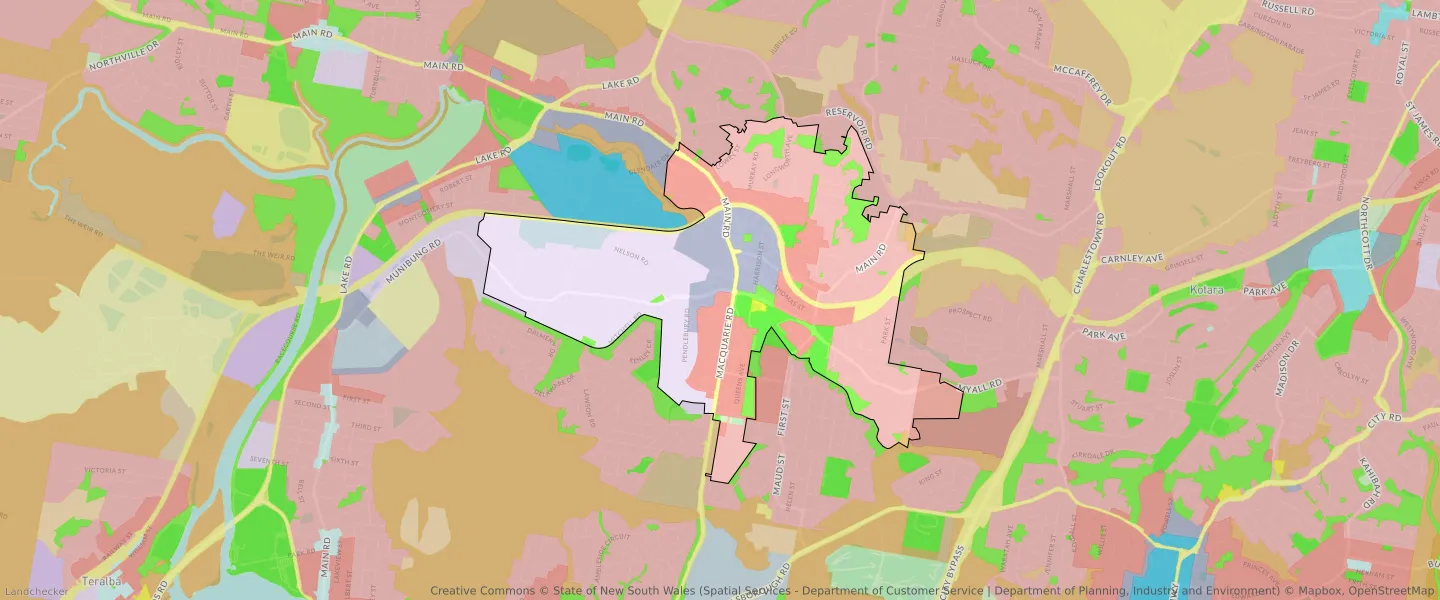
CARDIFF planning zones
| Zone Code | Zone Name | Percentage Covered | Area Covered | |
|---|---|---|---|---|
| C2 | Environmental Conservation | 0.51% | 25,623.38㎡ | |
| E3 | Business Development | 2.52% | 127,513.73㎡ | |
| E4 | General Industrial | 26.72% | 1,352,599.82㎡ | |
| MU1 | Mixed Use | 8.7% | 440,347.32㎡ | |
| R2 | Environmental Living | 29.7% | 1,503,866.5㎡ | |
| R3 | Medium Density Residential | 17.41% | 881,403.09㎡ | |
| RE1 | Low Density Residential | 8.89% | 450,117.69㎡ | |
| RE2 | Private Recreation | 0.17% | 8,559.59㎡ | |
| RU4 | Primary Production Small Lots | 0.16% | 8,344.37㎡ | |
| SP2 | Infrastructure | 5.05% | 255,491.32㎡ | |
| SP3 | Tourist | 0.18% | 9,173.49㎡ |
Looking to research a property in CARDIFF?
Go to mapData Source - ABS