Carcalgong NSW 2850
This Carcalgong suburb profile includes demographic data and planning information to help you make an informed property decision.
An average home in Carcalgong is owned with a mortgage by single person households. The average age in Carcalgong is 56. Separate houses are common in Carcalgong and the area is mostly Primary Production (63.37%), Infrastructure (17.2%) and Environmental Conservation (13.16%).
Carcalgong demographics
Population
45
Average Age
56
Age Distribution
Employment Type
Median Weekly Income
Traveled to Work
Car
92.3%
Tram
0.0%
Bicycle
0.0%
Train
0.0%
Walking
0.0%
Bus
0.0%
Carcalgong property information
Number of Bedrooms
Tenure Type
Property Types in Carcalgong
Separate house
Semi detached house
Unit/Apartment
Median monthly mortgage repayments
$1,685
Median weekly rental payments
$0
Average number of bedrooms per dwelling
2.3
Average number of people per household
2
Household Composition
Family Composition
Couple family without children
One parent family
Couple family with children
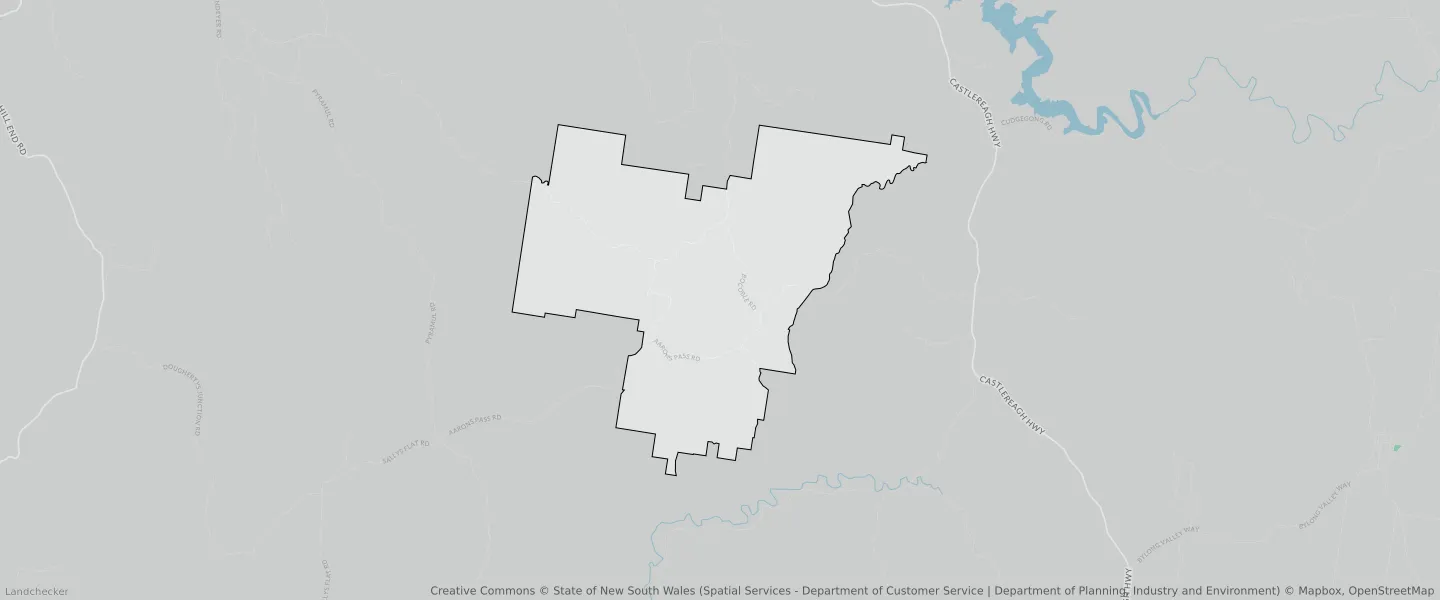
CARCALGONG planning zones
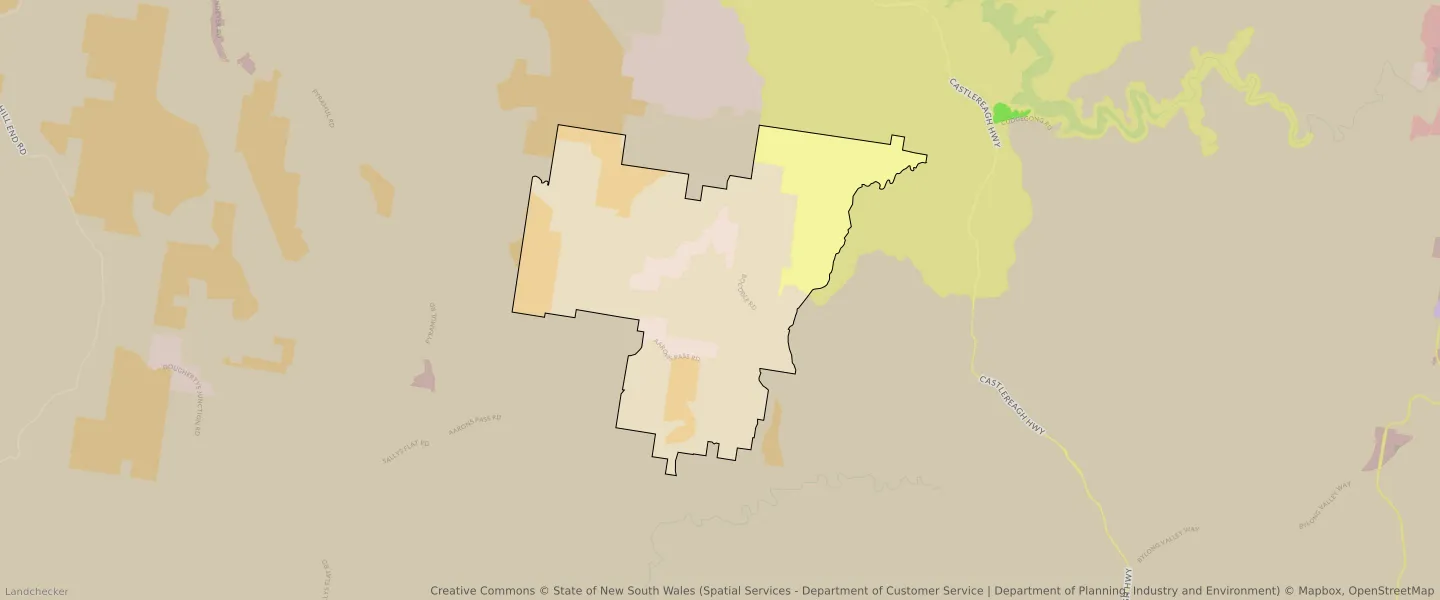
| Zone Code | Zone Name | Percentage Covered | Area Covered | |
|---|---|---|---|---|
| C3 | Environmental Conservation | 13.16% | 9,873,635.73㎡ | |
| R5 | Large Lot Residential | 6.27% | 4,700,786.25㎡ | |
| RU1 | Primary Production | 63.37% | 47,522,085.43㎡ | |
| SP2 | Infrastructure | 17.2% | 12,900,381.58㎡ |
Looking to research a property in CARCALGONG?
Go to mapData Source - ABS