Capalaba QLD 4157
This Capalaba suburb profile includes demographic data and planning information to help you make an informed property decision.
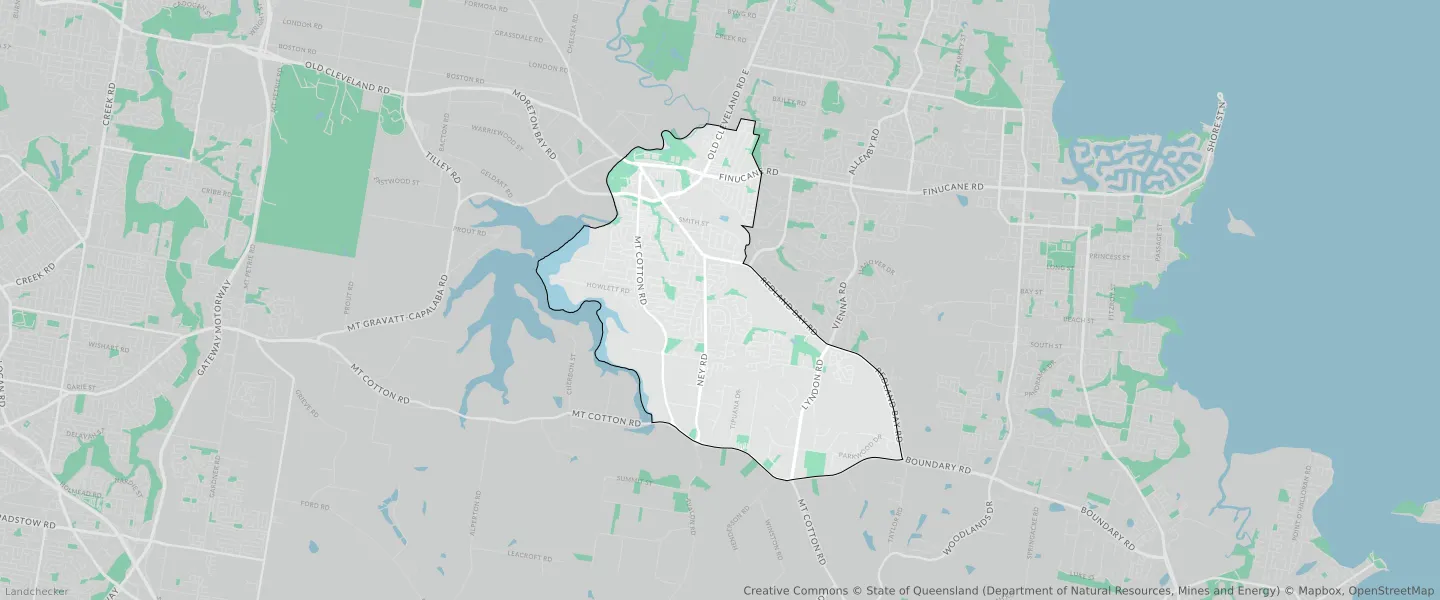
An average home in Capalaba is owned with a mortgage by couples with children. The average age in Capalaba is 39. Separate houses are common in Capalaba and the area is mostly Low Density Residential (37.17%), Conservation (14.19%) and Environmental Management (7.33%).
Capalaba demographics
Population
18002
Average Age
39
Age Distribution
Employment Type
Median Weekly Income
Traveled to Work
Car
86.9%
Tram
0.0%
Bicycle
0.3%
Train
0.5%
Walking
1.6%
Bus
2.2%
Capalaba property information
Number of Bedrooms
Tenure Type
Property Types in Capalaba
Separate house
Semi detached house
Unit/Apartment
Median monthly mortgage repayments
$1,785
Median weekly rental payments
$385
Average number of bedrooms per dwelling
3.3
Average number of people per household
3
Household Composition
Family Composition
Couple family without children
One parent family
Couple family with children
CAPALABA planning zones
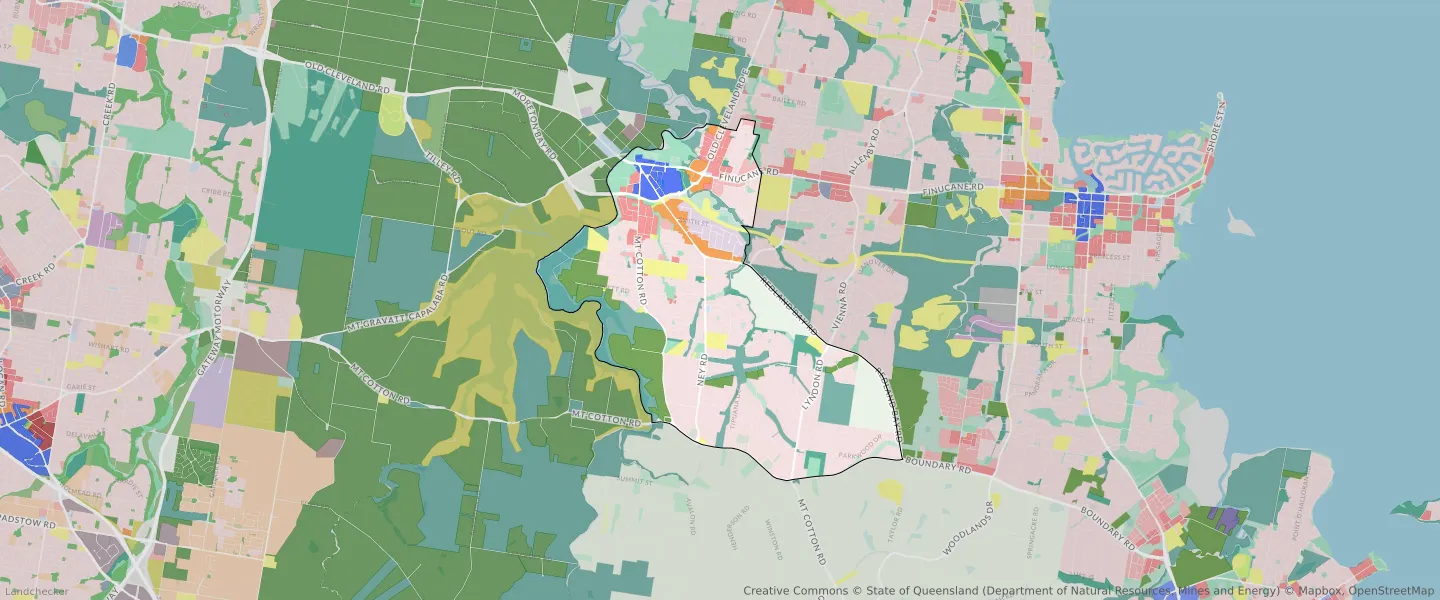
| Zone Code | Zone Name | Percentage Covered | Area Covered | |
|---|---|---|---|---|
| CF | Community Facilities | 3.55% | 664,686.73㎡ | |
| CN | Conservation | 14.19% | 2,657,016.92㎡ | |
| EM | Environmental Management | 7.33% | 1,371,573.63㎡ | |
| LDR | Low Density Residential | 37.17% | 6,957,352.27㎡ | |
| LI | Low Impact Industry | 1.81% | 339,734.87㎡ | |
| LMDR | Low-medium Density Residential | 1.11% | 208,509.95㎡ | |
| MDR | Medium Density Residential | 3.39% | 634,938.95㎡ | |
| MU | Mixed Use | 2.33% | 436,541.39㎡ | |
| NC | Neighbourhood Centre | 0.11% | 21,203.33㎡ | |
| PC | Principal Centre | 1.8% | 337,862.03㎡ | |
| R | Rural | 6.86% | 1,283,796.97㎡ | |
| ROS | Recreation and Open Space | 5.49% | 1,027,607.31㎡ |
Looking to research a property in CAPALABA?
Go to mapData Source - ABS