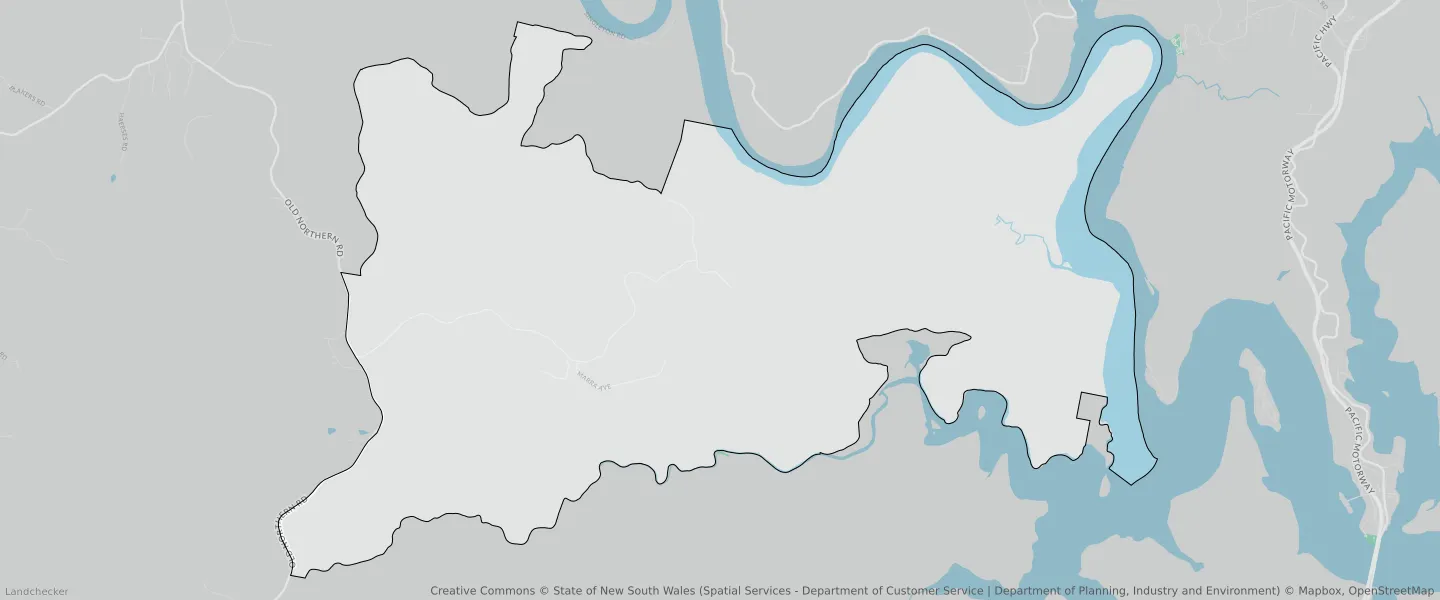
Canoelands NSW 2157
This Canoelands suburb profile includes demographic data and planning information to help you make an informed property decision.
An average home in Canoelands is owned with a mortgage by couples with children. The average age in Canoelands is 45. Separate houses are common in Canoelands and the area is mostly National Parks and Nature Reserves (72.47%), Environmental Conservation (9.21%) and Primary Production (8.33%).
Canoelands demographics
Population
177
Average Age
45
Age Distribution
Employment Type
Median Weekly Income
Traveled to Work
Car
83.0%
Tram
0.0%
Bicycle
0.0%
Train
0.0%
Walking
6.4%
Bus
0.0%
Canoelands property information
Number of Bedrooms
Tenure Type
Property Types in Canoelands
Separate house
Semi detached house
Unit/Apartment
Median monthly mortgage repayments
$2,084
Median weekly rental payments
$440
Average number of bedrooms per dwelling
3.5
Average number of people per household
3
Household Composition
Family Composition
Couple family without children
One parent family
Couple family with children
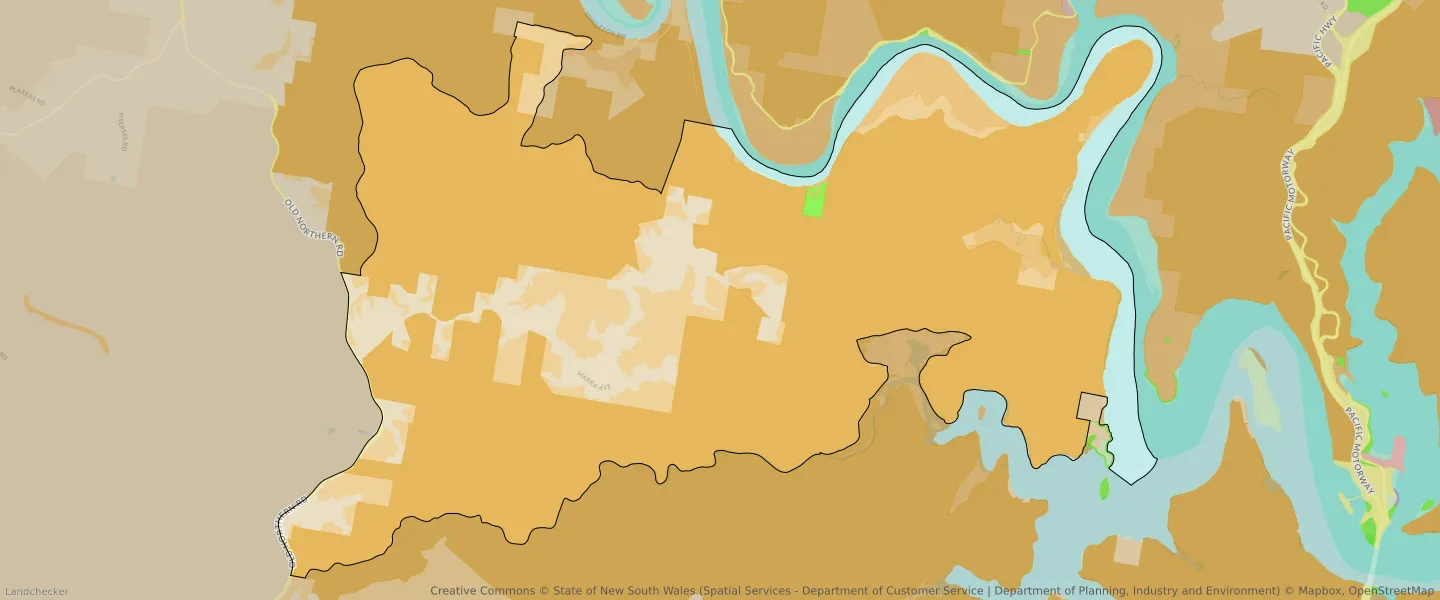
CANOELANDS planning zones
| Zone Code | Zone Name | Percentage Covered | Area Covered | |
|---|---|---|---|---|
| C1 | National Parks and Nature Reserves | 72.47% | 51,330,507.36㎡ | |
| C2 | Environmental Conservation | 3.06% | 2,164,698.76㎡ | |
| C3 | Environmental Conservation | 9.21% | 6,525,965.35㎡ | |
| RE1 | Low Density Residential | 0.19% | 132,512.71㎡ | |
| RU1 | Primary Production | 8.33% | 5,900,598.49㎡ | |
| RU2 | Rural Landscape | 0.07% | 46,323.83㎡ | |
| SP2 | Infrastructure | 0.19% | 137,263.57㎡ | |
| W1 | Environmental Living | 6.49% | 4,594,842.06㎡ |
Looking to research a property in CANOELANDS?
Go to mapData Source - ABS