Camellia NSW 2142
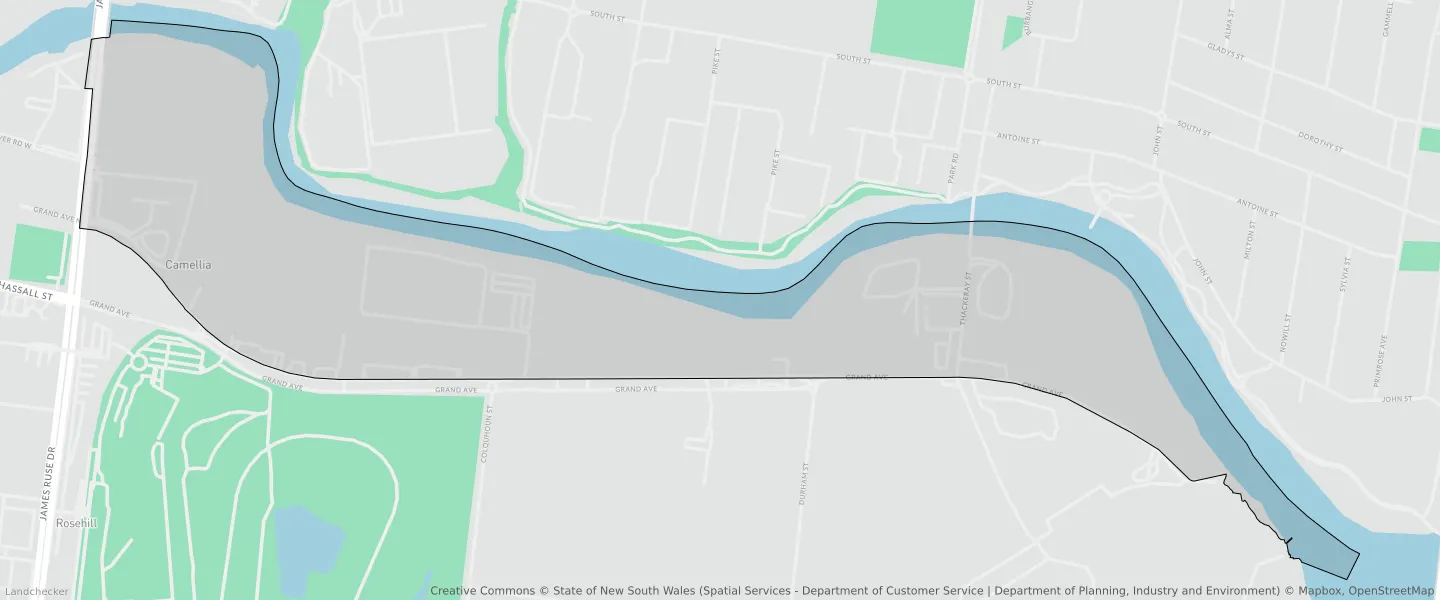
This Camellia suburb profile includes demographic data and planning information to help you make an informed property decision.
An average home in Camellia is other/not stated by group households. The average age in Camellia is 32. Units and Apartments are common in Camellia and the area is mostly Heavy Industrial (55.37%), Recreational Waterways (22.44%) and Business Development (14.04%).
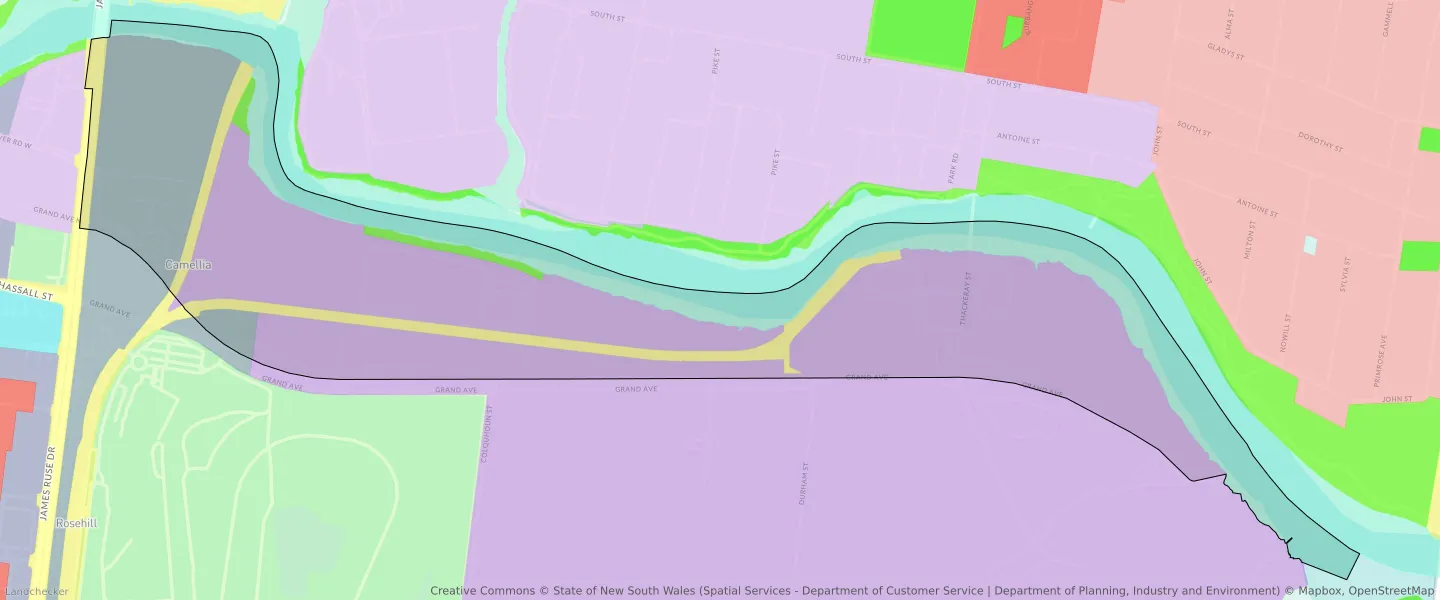
CAMELLIA planning zones
| Zone Code | Zone Name | Percentage Covered | Area Covered | |
|---|---|---|---|---|
| E3 | Business Development | 14.04% | 103,944.92㎡ | |
| E5 | Heavy Industrial | 55.37% | 410,026.48㎡ | |
| RE1 | Low Density Residential | 1.1% | 8,130.59㎡ | |
| SP2 | Infrastructure | 7.06% | 52,287.64㎡ | |
| W2 | Recreational Waterways | 22.44% | 166,177.65㎡ |
Looking to research a property in CAMELLIA?
Go to mapData Source - ABS