Cabarlah QLD 4352

This Cabarlah suburb profile includes demographic data and planning information to help you make an informed property decision.
An average home in Cabarlah is owned with a mortgage by couples with children. The average age in Cabarlah is 40. Separate houses are common in Cabarlah and the area is mostly Rural (59.52%), Rural Residential (19.92%) and Specialised Centre (11.11%).
Cabarlah demographics
Population
1307
Average Age
40
Age Distribution
Employment Type
Median Weekly Income
Traveled to Work
Car
73.7%
Tram
0.0%
Bicycle
1.0%
Train
0.0%
Walking
15.9%
Bus
0.9%
Cabarlah property information
Number of Bedrooms
Tenure Type
Property Types in Cabarlah
Separate house
Semi detached house
Unit/Apartment
Median monthly mortgage repayments
$2,000
Median weekly rental payments
$360
Average number of bedrooms per dwelling
3.9
Average number of people per household
3
Household Composition
Family Composition
Couple family without children
One parent family
Couple family with children
CABARLAH planning zones
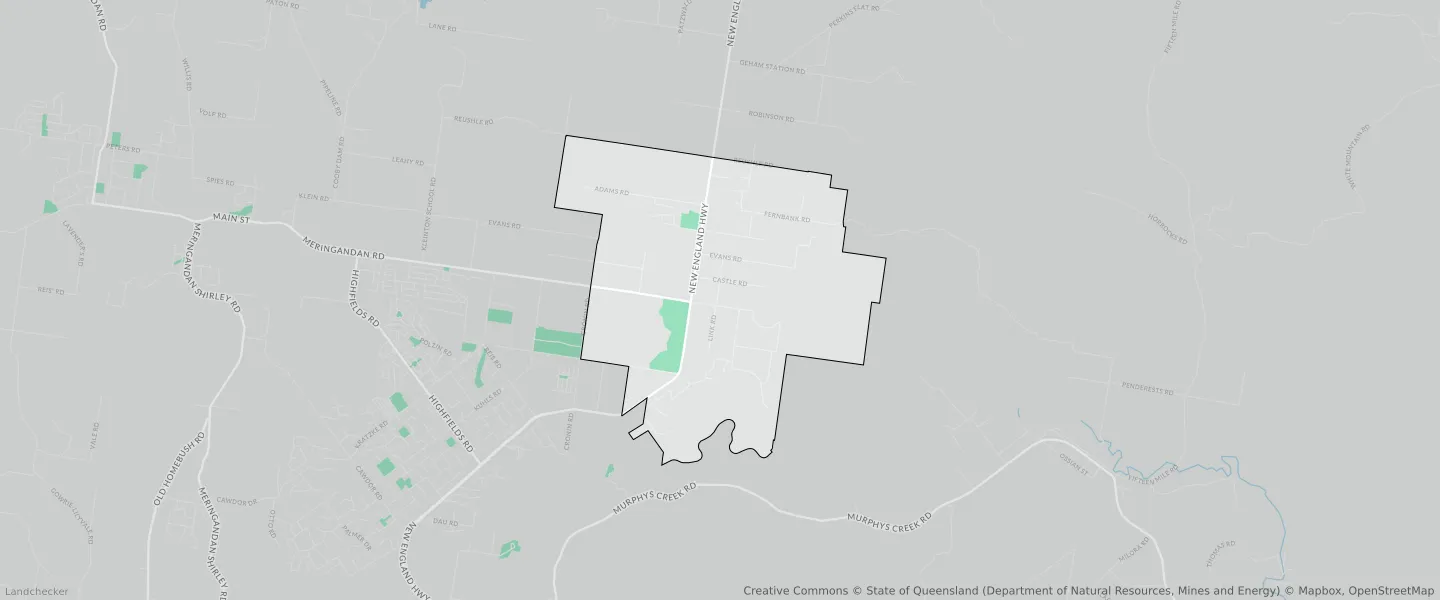
| Zone Code | Zone Name | Percentage Covered | Area Covered | |
|---|---|---|---|---|
| COMMUNITY FACILITIES | Community Facilities | 1.71% | 340,347.64㎡ | |
| LOW DENSITY RESIDENTIAL | Low Density Residential | 1.38% | 274,885.68㎡ | |
| OPEN SPACE | Open Space | 0.54% | 106,972.3㎡ | |
| RURAL | Rural | 0% | 17.98㎡ | |
| RURAL | Rural | 59.52% | 11,839,273.7㎡ | |
| RURAL RESIDENTIAL | Rural Residential | 19.92% | 3,963,165.39㎡ | |
| SPECIALISED CENTRE | Specialised Centre | 11.11% | 2,209,625.08㎡ |
Looking to research a property in CABARLAH?
Go to mapData Source - ABS