Buxton NSW 2571
This Buxton suburb profile includes demographic data and planning information to help you make an informed property decision.
An average home in Buxton is owned with a mortgage by couples with children. The average age in Buxton is 33. Separate houses are common in Buxton and the area is mostly Primary Production (24.15%), Primary Production Small Lots (16%) and Rural Landscape (15.71%).
Buxton demographics
Population
2071
Average Age
33
Age Distribution
Employment Type
Median Weekly Income
Traveled to Work
Car
90.3%
Tram
0.0%
Bicycle
0.0%
Train
0.0%
Walking
0.8%
Bus
0.0%
Buxton property information
Number of Bedrooms
Tenure Type
Property Types in Buxton
Separate house
Semi detached house
Unit/Apartment
Median monthly mortgage repayments
$2,102
Median weekly rental payments
$410
Average number of bedrooms per dwelling
3.6
Average number of people per household
3
Household Composition
Family Composition
Couple family without children
One parent family
Couple family with children
BUXTON planning zones
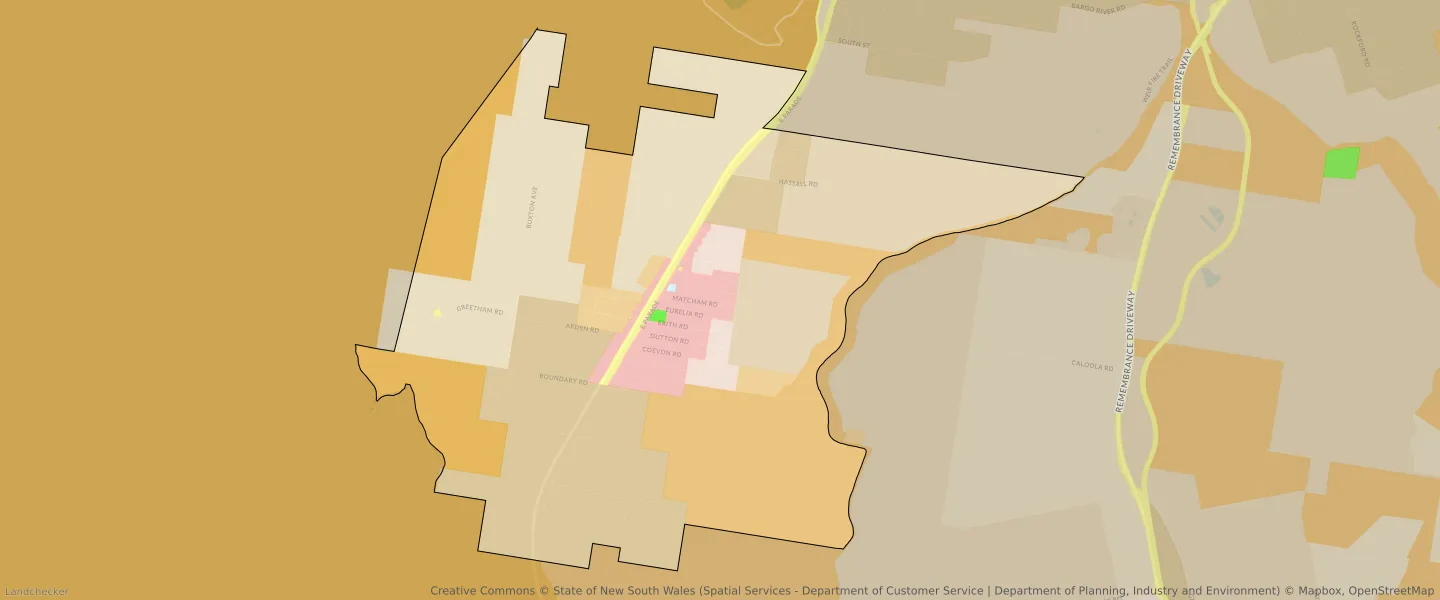
| Zone Code | Zone Name | Percentage Covered | Area Covered | |
|---|---|---|---|---|
| C1 | National Parks and Nature Reserves | 4.79% | 613,165.03㎡ | |
| C1 | National Parks and Nature Reserves | 4.35% | 557,520.79㎡ | |
| C2 | Environmental Conservation | 12% | 1,536,830.67㎡ | |
| C2 | Environmental Conservation | 7.14% | 914,317.91㎡ | |
| C3 | Environmental Conservation | 1.98% | 253,947.64㎡ | |
| R2 | Environmental Living | 5.05% | 646,480.36㎡ | |
| R5 | Large Lot Residential | 2.12% | 271,188.54㎡ | |
| RE1 | Low Density Residential | 0.08% | 10,441.79㎡ | |
| RU1 | Primary Production | 24.15% | 3,093,447.16㎡ | |
| RU2 | Rural Landscape | 15.71% | 2,012,736.11㎡ | |
| RU4 | Primary Production Small Lots | 5.36% | 687,169.12㎡ | |
| RU4 | Primary Production Small Lots | 16% | 2,048,592.46㎡ | |
| RU5 | Village | 0.03% | 3,999.87㎡ | |
| SP2 | Infrastructure | 1.25% | 159,847.55㎡ |
Looking to research a property in BUXTON?
Go to mapData Source - ABS