Burringbar NSW 2483
This Burringbar suburb profile includes demographic data and planning information to help you make an informed property decision.
An average home in Burringbar is owned with a mortgage by couples without children. The average age in Burringbar is 45. Separate houses are common in Burringbar and the area is mostly Rural Landscape (63.18%), National Parks and Nature Reserves (29.08%) and Deferred Matter (2.92%).
Burringbar demographics
Population
878
Average Age
45
Age Distribution
Employment Type
Median Weekly Income
Traveled to Work
Car
90.3%
Tram
0.0%
Bicycle
0.0%
Train
0.0%
Walking
1.8%
Bus
0.0%
Burringbar property information
Number of Bedrooms
Tenure Type
Property Types in Burringbar
Separate house
Semi detached house
Unit/Apartment
Median monthly mortgage repayments
$1,733
Median weekly rental payments
$400
Average number of bedrooms per dwelling
3.2
Average number of people per household
3
Household Composition
Family Composition
Couple family without children
One parent family
Couple family with children
BURRINGBAR planning zones
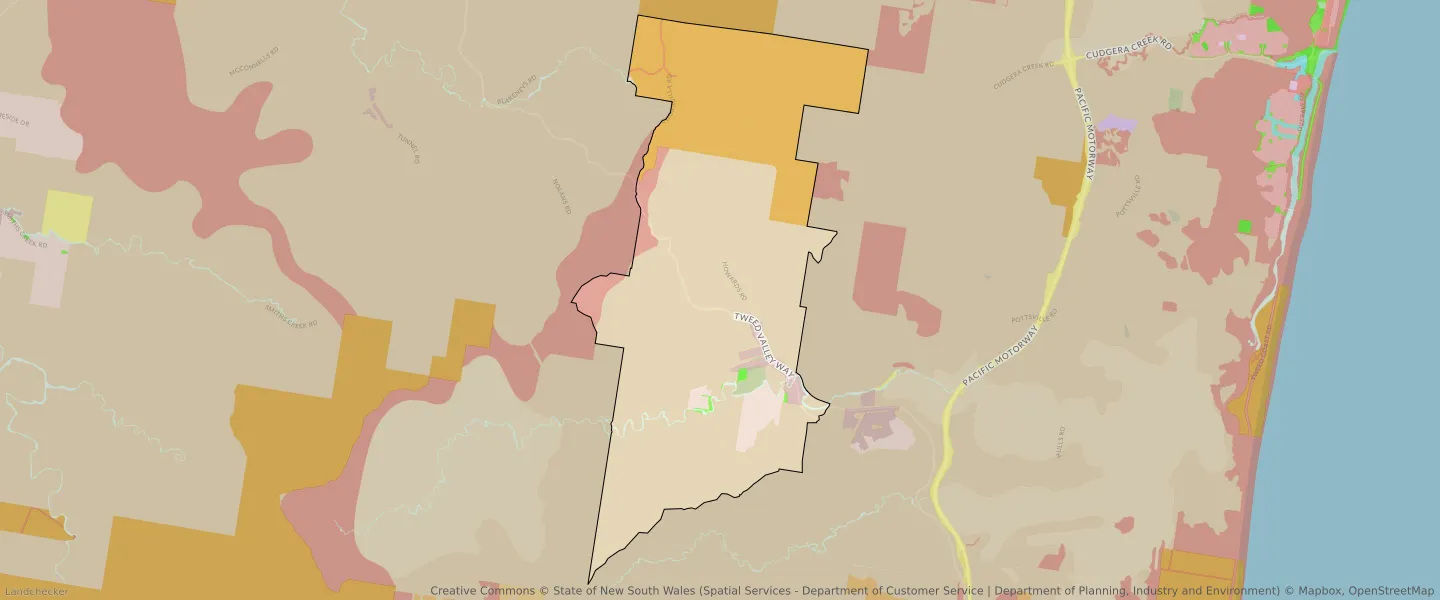
| Zone Code | Zone Name | Percentage Covered | Area Covered | |
|---|---|---|---|---|
| C1 | National Parks and Nature Reserves | 29.08% | 7,560,219.33㎡ | |
| DM | Deferred Matter | 2.92% | 759,011.44㎡ | |
| R5 | Large Lot Residential | 2.53% | 657,669.56㎡ | |
| RE1 | Low Density Residential | 0.23% | 58,659.58㎡ | |
| RU2 | Rural Landscape | 63.18% | 16,419,029.13㎡ | |
| RU5 | Village | 1.5% | 390,537.99㎡ | |
| W1 | Environmental Living | 0.56% | 145,854.73㎡ |
Looking to research a property in BURRINGBAR?
Go to mapData Source - ABS