Bungarribee NSW 2767
This Bungarribee suburb profile includes demographic data and planning information to help you make an informed property decision.
An average home in Bungarribee is owned with a mortgage by couples with children. The average age in Bungarribee is 33. Separate houses are common in Bungarribee and the area is mostly Medium Density Residential (15.8%), Low Density Residential (5.89%) and Infrastructure (2.11%).
Bungarribee demographics
Population
3177
Average Age
33
Age Distribution
Employment Type
Median Weekly Income
Traveled to Work
Car
87.3%
Tram
0.0%
Bicycle
0.0%
Train
4.9%
Walking
0.0%
Bus
1.0%
Bungarribee property information
Number of Bedrooms
Tenure Type
Property Types in Bungarribee
Separate house
Semi detached house
Unit/Apartment
Median monthly mortgage repayments
$2,600
Median weekly rental payments
$453
Average number of bedrooms per dwelling
4.1
Average number of people per household
4
Household Composition
Family Composition
Couple family without children
One parent family
Couple family with children
BUNGARRIBEE planning zones
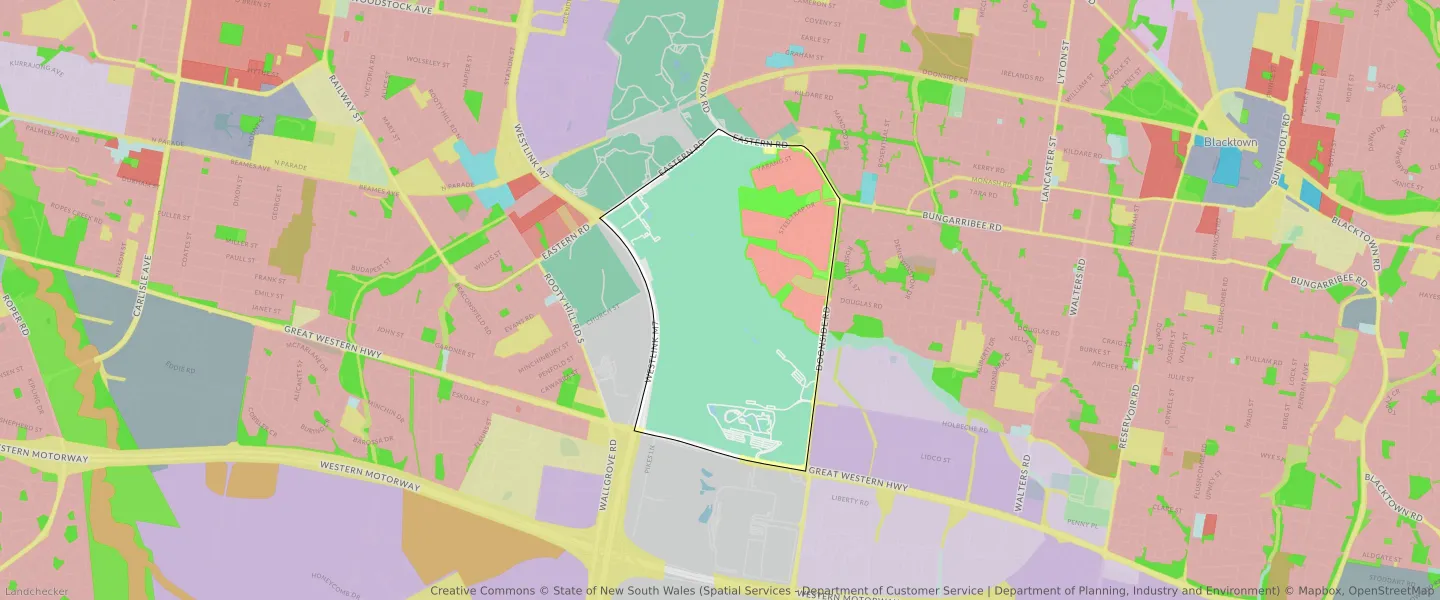
| Zone Code | Zone Name | Percentage Covered | Area Covered | |
|---|---|---|---|---|
| C3 | Environmental Conservation | 0.96% | 33,759.6㎡ | |
| R3 | Medium Density Residential | 15.8% | 556,067.47㎡ | |
| RE1 | Low Density Residential | 5.89% | 207,313.52㎡ | |
| SP2 | Infrastructure | 2.11% | 74,357.18㎡ |
Looking to research a property in BUNGARRIBEE?
Go to mapData Source - ABS